Download
1 / 14
140 likes | 275 Views
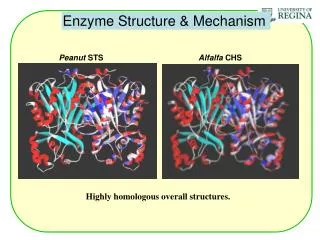
Anna Kotynia. STS SIMULATIONS. 8 stations fully based on micro-strip detectors. STS Detector. Tracking detector : - low-mass detector - full azimuthal angle coverage - polar angle coverage:from 2.5°to 25 ° - high track density in the inner-most region

E N D
Anna Kotynia STS SIMULATIONS
8 stations fully based on micro-strip detectors STS Detector Tracking detector: -low-mass detector -full azimuthalangle coverage -polar angle coverage:from 2.5°to 25° -high track density in the inner-most region -high collision rate-vertical magnetic field
SECTORS & MODULES Sensors: ● 300μm thick, ● 6cm wide , ● 2÷6 cm high Different z-position of each sensor; -> Outer regions coveredby larger sensors, oreven chainedsensors(1÷3 sensors in onesector), to minimizenumber of channels -> Small sensors in the inner region to reduce the occupancy;
7,5° front stereo angle & -7,5° back stereo angle STRIPS
Hit FindingEfficiency RESULTS
RESULTS C.D. Strip occupancy Hit density
all — all tracks, that are in acceptance. 8 sens — there were no gap and no overlap. 7 sens — there was 1 gap 6 sens — 2 gaps 9 sens — 1 overlap 10 sens — 2 overlaps 1 gap, 1 overlap — it is easy to understand
Signal: • 80e-/mm • (24000e- for 300mm silicon) • Noise: • 0.8 pF/cm in cables • ~1.5 pF/cm in sensors n-XYTER: fast: 26.9e/pF+200e slow: 12.7e/pF+233e EXAMPLE: 2cm sensor+30cm cable=>926e/576e 16cm sensor+ 3cm cable=>911e/569e Noise Calculations ADC signal on front strips ADC signal onback strips
DETECTOR RESPONCE Cluster width all 1 channel 2 channels 3 channels 4 channels 5 channels >5 channels Gaus Noise Threshold @ 8 Signal peak height [a.u.~1ke-]
Θ distribution in Au+Au central collision@ 25AGeV RESULTS Distance from the y-axis tothe outer regions of station
Software download source: • svn co https://subversions.gsi.de/fairroot/cbmroot/trunk • Ideal reconstruction: sts_reco.C • Real reconstruction: sts_reco_real.C • Geometry file: • sts_Standard_s3055AAFK5.SecD.geo • Parameters file: • sts_Standard_s3055AAFK5.SecD.digi.parsts_Standard_s3055AAFK5.SecD.7vs7.digi.par STS software status