Basic Data Analysis Methods
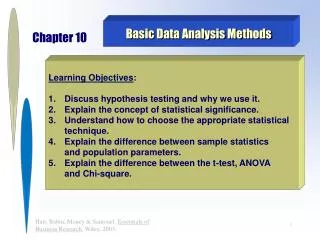
Chapter 10. Basic Data Analysis Methods. Learning Objectives : Discuss hypothesis testing and why we use it. Explain the concept of statistical significance. Understand how to choose the appropriate statistical technique. Explain the difference between sample statistics

Basic Data Analysis Methods
E N D
Presentation Transcript
Chapter 10 Basic Data Analysis Methods Learning Objectives: • Discuss hypothesis testing and why we use it. • Explain the concept of statistical significance. • Understand how to choose the appropriate statistical technique. • Explain the difference between sample statistics and population parameters. • Explain the difference between the t-test, ANOVA and Chi-square.
Hypothesis . . . . an unproven supposition or proposition that tentatively explains certain facts or phenomena.
Null vs. Alternative Hypotheses: • Null hypothesis = no difference in group means. • Alternative hypothesis = the opposite of the null hypothesis; i.e., there are differences in the group means.
Directional vs. Non-directional Hypotheses: • Directional = a hypothesis that uses terms like more than, less than, positive or negative in stating the relationship between two groups or two variables. • Non-directional = a hypothesis that postulates a difference, but does not indicate a direction for the differences or relationship.
Steps in Hypothesis Development and Testing: Step 1: State the null and alternative hypotheses. Step 2: Make a judgment about the population distribution, the level of measurement, and then select the appropriate statistical test. Step 3: Decide upon the desired level of significance. Step 4: Collect data from a sample and compute the statistical test to see if the level of significance is met. Step 5: Accept or reject the null hypothesis.
Sample Statistics vs. Population Parameters: • Sample statistics = variables or measures computed from the sample. • Population parameters = variables or measures of the population.
Type I and Type II Error Go On-Line www.mathacademy.com/pr/index.asp Type I Error = when the sample results lead to rejection of the null hypothesis when it is true. Type II Error = when the sample results lead to not rejecting the null hypothesis when it is in fact false.
Choosing the Appropriate Statistical Technique: The choice of a particular technique depends upon: • the number of variables. • the scale of measurement.
Statistics on the World Wide Web Chance www.dartmouth.edu/~chance/teaching_aids/data.html Data and Story Library http://lib.stat.cmu.edu/DASL/ Documents Center at Univ. of Michigan http://www.lib.umich.edu/govdocs/stats.html Electronic Encyclopedia of Statistical Exercises & Examples http://lib.stat.cmu.edu/DASL/Reference/eesee.html
Statistics on the World Wide Web FEDSTATS http://www.fedstats.gov/ Journal of Statistics Education www.amstat.org/publications/jse/ Statistics.com http://www.berinsteinresearch.com/stats.html StatLib http://lib.stat.cmu.edu/
Statistics on the World Wide Web StatWeb http://www.statsci.org/ WebStat http://www.stat.sc.edu/webstat/
Parametric vs. Nonparametric Tests Go On-Line http://www.stat.sc.edu/webstat/ Parametric = assume the sample data are normally distributed and measured using an interval or ratio scale. Nonparametric = no assumptions required about the distribution of the data and can be measured using a nominal or ordinal scale.
Univariate Bivariate Multivariate Three Approaches to Statistically Analyzing Sample Data:
Examples of propositions that can be tested using univariate statistics: Employee satisfaction at Microsoft is at least 5.5 on a 7-point scale. The new product will be preferred by 90 percent of our current customers. The average monthly electric bill in Atlanta, Georgia exceeds $300.00. The market share for Community Coffee in south Louisiana is at least 70 percent. More than 50 percent of current Diet Coke customers will prefer the new Diet Coke that includes lemon taste.
Exhibit 10-2 One Sample T-Test of Samouel’s and Gino’s Prices One-Sample Statistics
Exhibit 10-2 One Sample T-Test of Samouel’s and Gino’s Prices One-Sample Test
Examples of questions that could be answered using cross tabulations and testing with Chi-square analysis: Are gender and work type (full-time vs. part-time) at Samouel’s restaurant related? Do restaurant selection factor rankings (most important, 2nd most important, 3rd in importance, etc.) differ between males and females? Does frequency of patronage (very frequent, somewhat frequent and occasional) differ between Samouel’s and Gino’s restaurants? Is usage (heavy, moderate and low) of the Internet related to educational levels (elementary, middle, high school, some college, college degree, postgraduate work)? Is brand awareness (unaware, aware) related to the geographic area in which individuals live (North America, Europe, Asia, Africa, etc.)?
Examples of questions that could be answeredby testing differences in group means: Do the coffee consumption patterns (measured using the mean number of cups consumed daily) of males and females differ? Does the number of hours an individual spends on the Internet each week differ by income level? … by gender? … by education? Do younger workers exhibit higher job satisfaction than do older workers? Do big five accounting firms have a more favorable image than do regional accounting firms?
Independent vs. Related Samples On Line http://www.burgerking.com http://www.mcdonalds.com Independent Samples = when a sample of males and females are interviewed and their consumption of cokes is compared. Related Samples = when a sample of females is interviewed and the number of times a week they eat at Burger King® is compared to the number of times they eat at McDonalds ®.
Exhibit 10-5 Testing Differences in Two Means Using the T-Test Group Statistics
Exhibit 10-5 Testing Differences in Two Means Using the T-Test Independent Samples Test
ANOVA . . . . is used to assess the statistical differences between the means of two or more groups of respondents.
Exhibit 10-6 Analysis of Variance Testing Mean Differences in Satisfaction Levels of Samoul’s Customers Based on Frequency of Patronage X17 – Satisfaction
Exhibit 10-6 Analysis of Variance Testing Mean Differences in Satisfaction Levels of Samoul’s Customers Based on Frequency of Patronage ANOVA Table
Exhibit 10-6 Analysis of Variance Testing Mean Differences in Satisfaction Levels of Samouel’s Customers Based on Frequency of Patronage ANOVA Table
Exhibit 10-7 The Scheffe Test for Differencesin Group Means X17 – Satisfaction
Exhibit 10-7 The Scheffe Test for Differencesin Group Means X17 – Satisfaction
One-Way vs. Two-Way ANOVA One-Way ANOVA = a single non-metric independent variable and a single metric dependent variable. Two-Way ANOVA = two or more non-metric independent variables and a single metric dependent variable.
Factorial Designs Factorial Designs, also referred to as two-way ANOVA, test three hypotheses: (1) the effect of independent variable one on the dependent variable; (2) the effect of independent variable two on the dependent variable; and (3) the combined (joint) effect of variables one and two on the dependent variable. The effects of the two independent variables are referred to as main effects, and their combined effect is referred to as the interaction effect.
MANOVA MANOVA (multivariate analysis of variance) assesses group differences across multiple metric dependent variables at the same time.
Basic Data Analysis Methods Go On-Line www.yankelovich.com Go On-Line www.raosoft.com How can business researchers use the data from the research reported on these Web sites?
Basic Data Analysis Methods Go On-Line www.surveysystem.com/sscalc.htm http://www.upromote.com Go On-Line www.dssresearch.com/mainsite/surveys.htm What can business researchers learn from these Web sites?