Download
1 / 31
330 likes | 493 Views
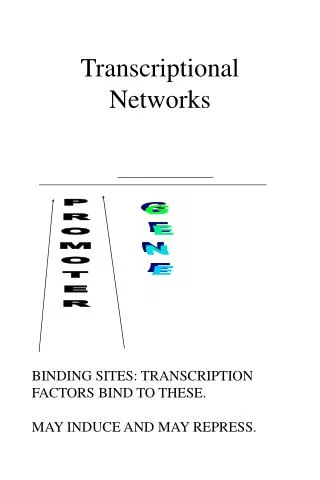
Intro: Transcriptional regulatory networks. RegulonDB: database with information on transcriptional regulation and operon organization in E.coli; 105 regulators affecting 749 genes

E N D
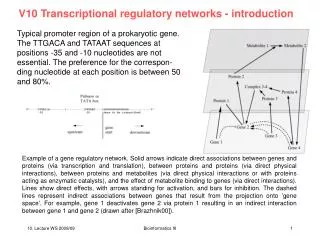
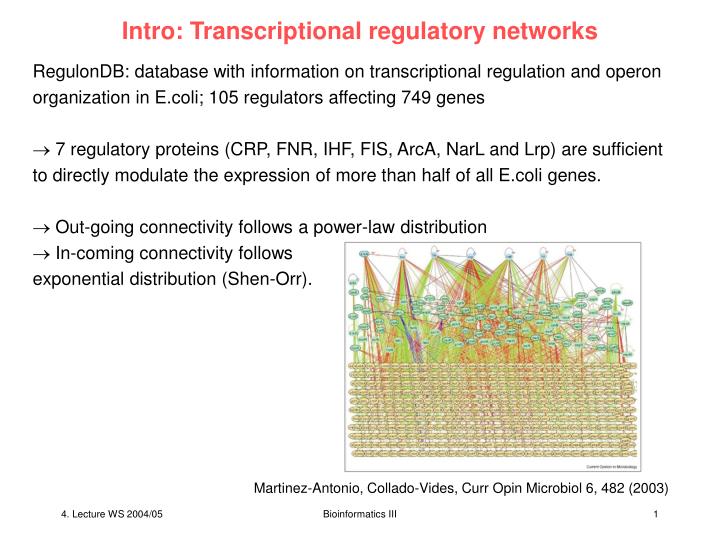
Intro: Transcriptional regulatory networks • RegulonDB: database with information on transcriptional regulation and operon organization in E.coli; 105 regulators affecting 749 genes • 7 regulatory proteins (CRP, FNR, IHF, FIS, ArcA, NarL and Lrp) are sufficient to directly modulate the expression of more than half of all E.coli genes. • Out-going connectivity follows a power-law distribution • In-coming connectivity follows exponential distribution (Shen-Orr). Martinez-Antonio, Collado-Vides, Curr Opin Microbiol 6, 482 (2003) Bioinformatics III
Intro: frequency of co-regulation Regulation by multiple TFs occurs in half of genes. In most cases, a „gobal“ regulator (with > 10 interactions) works together with a more specific local regulator. Martinez-Antonio, Collado-Vides, Curr Opin Microbiol 6, 482 (2003) Bioinformatics III
Intro: regulation of TFs and club co-regulation However, in a process of decisions and information flux, the number of controlled or affected elements is not the only factor to be considered. A hierarchy of different levels of decision is natural to our understanding of how things get done. In general, global regulators work together with other global regulators. Dynamics of decison-making is a cooperative process of different subsets of the network put into action at certain moments. Martinez-Antonio, Collado-Vides, Curr Opin Microbiol 6, 482 (2003) Bioinformatics III
Intro: response to changes in environmental conditions The second function of TFs is to sense changes in environmental conditions or other internal signals encoding changes. Global environment growth conditions in which TFs are regulating. # in brackets indicates how many additional TFs participate in the same number of conditions. Martinez-Antonio, Collado-Vides, Curr Opin Microbiol 6, 482 (2003) Bioinformatics III
Do we need to rely on experiments? Determine homology between the domains and protein families of TFs and regulated genes and proteins of known 3D structure. Determine uncharacterized E.coli proteins with DNA-binding domains, thus identify large majority of E.coli TFs. Finding: 75% of all TFs are two-domain proteins. Analysis of domain architecture shows that 75% of the TFs have arisen by gene duplication. Sarah Teichmann MRC LMB Cambridge Madan Babu, PhD student at LMB Babu, Teichmann, Nucl. Acid Res. 31, 1234 (2003) Bioinformatics III
Flow chart of method to identify TFs in E.coli SUPERFAMILY database (C. Chothia) contains a library of HMM models based on the sequences of proteins in SCOP for predicted proteins of completely sequenced genomes. In addition to our set of 271 transcription factors, there are eight transcription factors without a DBD assignment that have known regulatory information. Remove all DNA-binding proteins involved in replication/repair etc. Babu, Teichmann, Nucl. Acid Res. 31, 1234 (2003) Bioinformatics III
3D structures of putative (and real) TFs in E.coli The three-dimensional structures of the 11 DBD families seen in the 271 identified transcription factors in E.coli. The figure highlights the fact that even though the helix–turn–helix motif occurs in all families except the nucleic acid binding family, the scaffolds in which the motif occurs are very different. Babu, Teichmann, Nucl. Acid Res. 31, 1234 (2003) Bioinformatics III
Domain architectures of TFs The 74 unique domain architectures of the 271 identified TFs. Each functional class is represented by a different shape and each family within the functional class is represented by a different colour. The DBDs are represented as rectangles. The partner domains are represented as hexagons (small molecule-binding domain), triangles (enzyme domains), circles (protein interaction domain), diamonds (domains of unknown function) and the receiver domain has a pentagonal shape. The letters A, R, D and U denote activators, repressors, dual regulators and TFs of unknown function, and the number of TFs of each type is given next to each domain architecture. Architectures of known 3D structure are denoted by asterisks, and ‘+’ are cases where the regulatory function of a TF has been inferred by indirect methods, so that the DNA-binding site is not known. Babu, Teichmann, Nucl. Acid Res. 31, 1234 (2003) Bioinformatics III
Evolution of TFs 10% 1-domain proteins 75% 2-domain proteins 12% 3-domain proteins 3% 4-domain proteins TFs have evolved by extensive recombination of domains. Proteins with the same sequential arrangement of domains are likely to be direct duplicates of each other. 74 distinct domain architectures have duplicated to give rise to 271 TFs. Babu, Teichmann, Nucl. Acid Res. 31, 1234 (2003) Bioinformatics III
Organisation of transcriptional regulatory network For 121 TFs, there is information on their regulated genes. They can be divided into 10 general functional categories. Babu, Teichmann, Nucl. Acid Res. 31, 1234 (2003) Bioinformatics III
Regulatory cascades The TF regulatory network in E.coli. When more than one TF regulates a gene, the order of their binding sites is as given in the figure. An arrowhead is used to indicate positive regulation when the position of the binding site is known. Horizontal bars indicates negative regulation when the position of the binding site is known. In cases where only the nature of regulation is known, without binding site information, + and – are used to indicate positive and negative regulation. The DBD families are indicated by circles of different colours as given in the key. The names of global regulators are in bold. Babu, Teichmann, Nucl. Acid Res. 31, 1234 (2003) Bioinformatics III
Design principles of regulatory networks Wiring diagrams of regulatory networks resemble somehow electrical circuits. Try to break down networks into basic building blocks. Search for „network motifs“ as patterns of interconnections that recur in many different parts of a network at frequencies much higher than those found in randomized networks. Uri Alon Weizman Institute Shen-Orr et al. Nature Gen. 31, 64 (2002) Bioinformatics III
Detection of motifs Represent transcriptional network as a connectivity matrix M such that Mij= 1 if operon j encodes a TF that transcriptionally regulates operon i and Mij= 0 otherwise. Scan all n × n submatrices of M generated by choosing n nodes that lie in a connected graph, for n = 3 and n = 4. Submatrices were enumerated efficiently by recursively searching for nonzero elements. Compute a P value for submatrices representing each type of connected subgraph by comparing # of times they appear in real network vs. in random network. For n = 3, the only significant motif is the feedforward loop. For n = 4, only the overlapping regulation motif is significant. SIMs and multi-input modules were identified by searching for identical rows of M. Shen-Orr et al. Nature Gen. 31, 64 (2002) Bioinformatics III
DOR detection Consider all operons regulated by ≥ 2 TFs. Define (nonmetric) distance measure between operons k and j, based on the # of TFs regulating both operons: d(k,j) = 1/ (1+n fnMk,n Mj,n)2) Where fn = 0.5 for global TFs and fn = 1 otherwise. Cluster operons with average-linkage algorithm. DORs correspond to clusters with more than 10 connections with a ratio of connections to TFs > 2. Shen-Orr et al. Nature Gen. 31, 64 (2002) Bioinformatics III
Network motifs found in E.coli transcript-regul network a, Feedforward loop: a TF X regulates a second TF Y, and both jointly regulate one or more operons Z1...Zn. b, Example of a feedforward loop (L-arabinose utilization). c, SIM motif: a single TF, X, regulates a set of operons Z1...Zn. X is usually autoregulatory. All regulations are of the same sign. No other transcription factor regulates the operons. d, Example of a SIM system (arginine biosynthesis). e, DOR motif: a set of operons Z1...Zm are each regulated by a combination of a set of input transcription factors, X1...Xn. DOR-algorithm detects dense regions of connections, with a high ratio of connections to transcription factors. f, Example of a DOR (stationary phase response). Shen-Orr et al. Nature Gen. 31, 64 (2002) Bioinformatics III
Significance of motifs Shen-Orr et al. Nature Gen. 31, 64 (2002) Bioinformatics III
Regulatory network Each TF appears only in a single subgraph except for global TFs that can appear in several subgraphs. Shen-Orr et al. Nature Gen. 31, 64 (2002) Bioinformatics III
Regulatory networks Shen-Orr et al. Nature Gen. 31, 64 (2002) Bioinformatics III
Structural organization of transcript-regul networks Modules: observation that reg. Networks are highly interconnected, very few modules can be entirely separated from the rest of the network. Babu et al. Curr Opin Struct Biol. 14, 283 (2004) Bioinformatics III
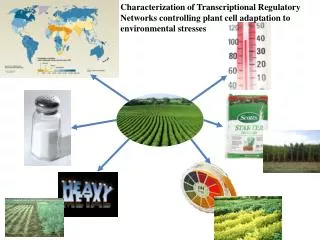
Evolution of the gene regulatory network Larger genomes tend to have more TFs per gene. Babu et al. Curr Opin Struct Biol. 14, 283 (2004) Bioinformatics III
Cross-organism comparison Many TF families are specific to individual phylogenetic groups or greatly expanded in some genomes. In contrast to the high level of conservation of other regulatory and signalling systems across the crown group eukaryotes, some of the TF families are dramatically different in the various lineages. Babu et al. Curr Opin Struct Biol. 14, 283 (2004) Bioinformatics III
Regulatory interactions across organisms Are regulatory interactions conserved among organisms? Apparently yes. Orthologous TFs regulate orthologous target genes. As expected, the conservation of genes and interaction is related to the phylogenetic difference between organisms. Above: Many interactions of (a) can be mapped to pathogenetic Pseudomonas aeruginosa that is related to E.coli (b). Very few interactions can be mapped from (a) to (c). Babu et al. Curr Opin Struct Biol. 14, 283 (2004) Bioinformatics III
Regulatory interactions across organisms • Observation: there is no bias towards conservation of network motifs. • Regulatory interactions in motifs are lost or retained at the same rate as the other interactions in the network. • The transcriptional network appears to evolve in a step-wise manner, with loss and gain of individual interactions probably playing a greater role than loss and gain of whole motifs or modules. Observation: TFs are less conserved than target genes, which suggests that regulation of genes evolves faster than the genes themselves. Babu et al. Curr Opin Struct Biol. 14, 283 (2004) Bioinformatics III
Something spectacular at the end Integrate transcriptional regulatory information and gene-expression data for multiple conditions in Saccharomyces cerevisae. 5 conditions cell cycle sporulation diauxic shift DNA damage stress response Luscombe, Babu, … Teichmann, Gerstein, Nature 431, 308 (2004) Bioinformatics III
SANDY: topological measures + network motifs + some post-analysis Luscombe et al. Nature 431, 308 (2004) Bioinformatics III
Dynamic representation of transript. regul. network a, Schematics and summary of properties for the endogenous and exogenous sub-networks. b, Graphs of the static and condition-specific networks. Transcription factors and target genes are shown as nodes in the upper and lower sections of each graph respectively, and regulatory interactions are drawn as edges; they are coloured by the number of conditions in which they are active. Different conditions use distinct sections of the network. c, Standard statistics (global topological measures and local network motifs) describing network structures. These vary between endogenous and exogenous conditions; those that are high compared with other conditions are shaded. (Note, the graph for the static state displays only sections that are active in at least one condition, but the table provides statistics for the entire network including inactive regions.) Luscombe, Babu, … Teichmann, Gerstein, Nature 431, 308 (2004) Bioinformatics III
Interpretation Half of the targets are uniquely expressed in only one condition; in contrast, most TFs are used across multiple processes. The active sub-networks maintain or rewire regulatory interactions, over half of the active interactions are completely supplanted by new ones between conditions. Only 66 interactions are retained across ≥ 4 conditions. They are always „on“ and mostly regulate house-keeping functions. The calculations divide the 5 condition-specific networks into 2 categories: endogenous and exogenous. Endogenous processes are multi-stage, operate with an internal transcriptional program Exogenous processes are binary events that react to external stimuli with a rapid turnover of expressed genes. Luscombe et al. Nature 431, 308 (2004) Bioinformatics III
Figure 2 Newly derived 'follow-on' statistics for network structures. a, TF hub usage in different cellular conditions. The cluster diagram shades cells by the normalized number of genes targeted by TF hubs in each condition. One cluster represents permanent hubs and the others condition-specific transient hubs. Genes are labelled with four-letter names when they have an obvious functional role in the condition, and seven-letter open reading frame names when there is no obvious role. Of the latter, gene names are red and italicised when functions are poorly characterized. Starred hubs show extreme interchange index values, I = 1. b, Interaction interchange (I) of TF between conditions. A histogram of I for all active TFs shows a uni-modal distribution with two extremes. Pie charts show five example TFs with different proportions of interchanged interactions. We list the main functions of the distinct target genes regulated by each example transcription factor. Note how the TFs' regulatory functions change between conditions. c, Overlap in TF usage between conditions. Venn diagrams show the numbers of individual TFs (large intersection) and pair-wise TF combinations (small intersection) that overlap between the two endogenous conditions. Luscombe et al. Nature 431, 308 (2004) Bioinformatics III
Interpretation Most hubs (78%) are transient = they are influential in one condition, but less so in others. Exogenous conditions have fewer transient hubs (different ). „Transient hub“: capacity to change interactions between connections. Luscombe et al. Nature 431, 308 (2004) Bioinformatics III
TF inter-regulation during the cell cycle time-course a, The 70 TFs active in the cell cycle. The diagram shades each cell by the normalized number of genes targeted by each TF in a phase. Five clusters represent phase-specific TFs and one cluster is for ubiquitously active TFs. Both hub and non-hub TFs are included. b, Serial inter-regulation between phase-specific TFs. Network diagrams show TFs that are active in one phase regulate TFs in subsequent phases. In the late phases, TFs apparently regulate those in the next cycle. c, Parallel inter-regulation between phase-specific and ubiquitous TFs in a two-tiered hierarchy. Serial and parallel inter-regulation operate in tandem to drive the cell cycle while balancing it with basic house-keeping processes. Luscombe et al. Nature 431, 308 (2004) Bioinformatics III
Summary • Integrated analysis of transcriptional regulatory information and condition-specific • gene-expression data; post-analysis, e.g. • Identification of permanent and transient hubs • interchange index • overlap in TF usage across multiple conditions. • Large changes in underlying network architecture • in response to diverse stimuli, TFs alter their interactions to varying degrees, thereby rewiring the network • some TFs serve as permanent hubs, most act transiently • environmental responses facilitate fast signal propagation • cell cycle and sporulation proceed via multiple stages • Many of these concepts may also apply to other biological networks. Luscombe et al. Nature 431, 308 (2004) Bioinformatics III