Download
1 / 8
80 likes | 227 Views
Advances in Multi-scale Modeling of Global Water and Energy Cycles Karen Mohr 1 , Wei- Kuo Tao 1 , and Jiun -Dar Chern 1,2 , Code 613.1 1 NASA GSFC and 2 GEST/UMBC. CMORPH, 0.25° 2.52 mm/day.

E N D
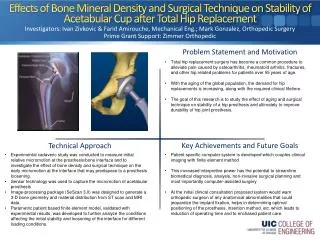
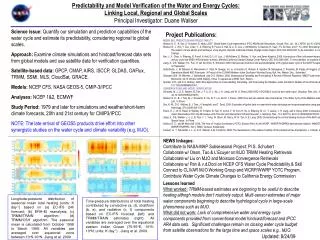
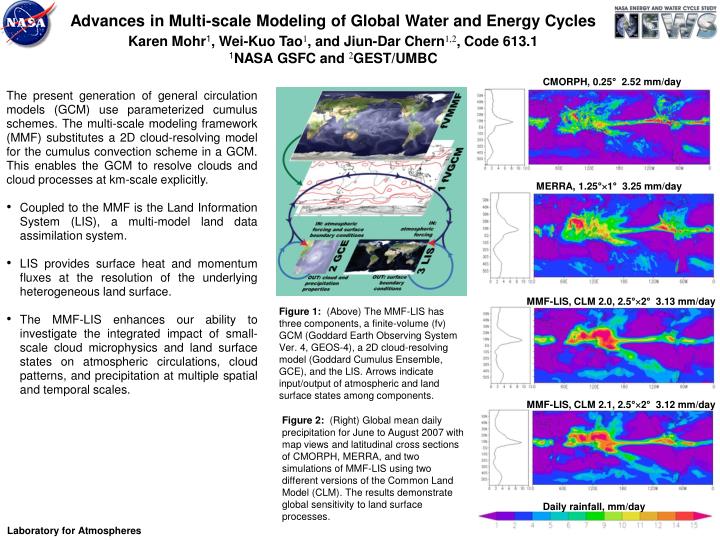
Advances in Multi-scale Modeling of Global Water and Energy Cycles Karen Mohr1, Wei-Kuo Tao1, and Jiun-Dar Chern1,2, Code 613.1 1NASA GSFC and 2GEST/UMBC CMORPH, 0.25° 2.52 mm/day • The present generation of general circulation models (GCM) use parameterized cumulus schemes. The multi-scale modeling framework (MMF) substitutes a 2D cloud-resolving model for the cumulus convection scheme in a GCM. This enables the GCM to resolve clouds and cloud processes at km-scale explicitly. • Coupled to the MMF is the Land Information System (LIS), a multi-model land data assimilation system. • LIS provides surface heat and momentum fluxes at the resolution of the underlying heterogeneous land surface. • The MMF-LIS enhances our ability to investigate the integrated impact of small-scale cloud microphysics and land surface states on atmospheric circulations, cloud patterns, and precipitation at multiple spatial and temporal scales. MERRA, 1.25°1° 3.25 mm/day MMF-LIS, CLM 2.0, 2.5°2° 3.13 mm/day Figure 1:(Above) The MMF-LIS has three components, a finite-volume (fv) GCM (Goddard Earth Observing System Ver. 4, GEOS-4), a 2D cloud-resolving model (Goddard Cumulus Ensemble, GCE), and the LIS. Arrows indicate input/output of atmospheric and land surface states among components. MMF-LIS, CLM 2.1, 2.5°2° 3.12 mm/day Figure 2: (Right) Global mean daily precipitation for June to August 2007 with map views and latitudinal cross sections of CMORPH, MERRA, and two simulations of MMF-LIS using two different versions of the Common Land Model (CLM). The results demonstrate global sensitivity to land surface processes. Daily rainfall, mm/day Laboratory for Atmospheres
Name: Karen Mohr, NASA/GSFC, Code 613.1 E-mail: karen.mohr-1@nasa.gov Phone: 301-614-6360 References: Mohr, K.I., W.-K. Tao, J.-D. Chern, S.V. Kumar, C.D. Peters-Lidard, 2011: The NASA-Goddard multi-scale modeling framework-Land Information System: A global modeling system with resolved convection, Environmental Modeling and Software, submitted. Tao, W.-K., J.-D. Chern, R. Atlas, D. Randall, M. Khairoutdinov, J.-L. Li, D.E. Waliser, A. Hou, X. Lin, C. Peters-Lidard, W. Lau, J. Jiang, and J. Simpson, 2009. A multiscale modeling system: Developments, applications, and critical issues. Bulletin of the American Meteorological Society, 90, 515-534. Data Sources: Parameter datasets for LIS include MODIS land cover classes, GTOPO30 elevations, FAO soil fractions maps. Forcing datasets on fvGCM include NOAA weekly Reynolds Optimum Interpolation SST Analysis Ver. 2, and ozone product merging the NASA UARS measurements with the Atmospheric Model Intercomparison Project 2 ozone dataset. Validation and comparison datasets include MERRA, NCEP reanalysis, CMORPH rainfall (shown), TRMM rainfall, FLUXNET surface fluxes. Technical Description of Figures: Figure 1: The integration and coupling of the components of MMF-LIS. The three principal components are a finite-volume (fv) GCM (Goddard Earth Observing System Ver. 4, GEOS-4), a 2D CRM (Goddard Cumulus Ensemble, GCE), and the LIS, representing the large-scale atmospheric circulation, cloud processes, and land surface processes, respectively. The arrows indicate the flow of information through fvGCM on atmospheric states (temperature, pressure, winds, precipitation) to LIS and land surface states (surface heat and momentum fluxes) from LIS to fvGCM and then to GCE. The GEOS-4 was developed by GMAO (610.1), GCE by the Mesoscale Modeling group of the Mesoscale Processes Branch (613.1), and LIS by the Hydrologic Sciences Branch (614.3). On-going improvements include upgrading GEOS-4 to GEOS-5 and adding an interactive ocean model to reduce precipitation biases over the tropical oceans. Figure 2: A free-running (no data assimilation) global simulation of 2007-2008 by MMF-LIS was conducted using two different versions of the Common Land Model (CLM 2.0 and 2.1) in LIS. Resolution of the fvGCM was 2.5°2°, 4-km for GCE. The results for global mean daily precipitation for June-August 2007 for CMORPH and two simulations of MMF-LIS are depicted. Although there are positive precipitation biases over the Pacific warm pool and a negative precipitation bias in the central US, the magnitude and extent of precipitation in MMF-LIS compares favorably to the CMORPH in difficult to simulate regions such as the mid-latitude storm tracks, the eastern Pacific ITCZ, central Asia, and sub-Saharan Africa. This is particularly apparent in the bottom panel, the modified version of CLM, version 2.1. As most GCMs are coupled to a single land surface model, a singular advantage provided by LIS is the ability to run multiple land surface models, ensemble land surface modeling in a global framework. The differences between the MMF-LIS panels demonstrate global sensitivity to integrated local-scale land surface processes. Scientific significance: Improved representation of the water and energy cycles is critical to global weather and climate simulation. The MMF-LIS explicitly accounts for km-scale cloud and land surface processes. This model framework concept shows promise in improving the simulation of global precipitation and thus atmospheric circulations at multiple scales without significant increases in computational overhead. Relevance for future science and relationship to Decadal Survey: The NASA Energy and Water Cycle Study (NEWS) grand challenge is to document and enable improved predictions of water and energy cycle consequences of Earth system variability and change. Use and improvement of the MMF-LIS global modeling framework will help us understand how small-scale atmospheric and surface changes will feedback to global energy and water cycles and then affect weather and climate systems. Laboratory for Atmospheres
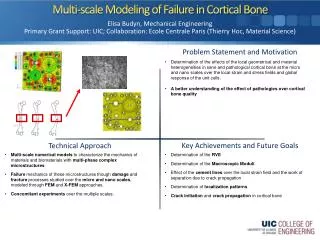
Validation of Cirrus Cloud Properties Derived from CALIPSO John E. Yorks, Code 613.1, NASA GSFC and SSAI The CALIPSO satellite provides the science community with a 5-year global data set of cloud and aerosol properties that have a large range of applications to significant climate system studies, such as developing global cloud statistics and investigating cloud-aerosol radiative effects. In this study, we determine how cirrus cloud properties from CALIPSO data products perform in comparison with observations by the airborne Cloud Physics Lidar (CPL). CPL was flown on the NASA ER-2 aircraft for 10 flights in the summer of 2006 (SE USA) to validate the CALIPSO measurements with collocated data. Our analysis illustrates issues attributed to differences in instrument noise (daytime) and multiple scattering effects (opaque clouds). However, CPL and CALIPSO are in agreement for about 90% of total measurements and 94% of nighttime measurements. Figure 1. Cloud area detection frequency per range (height) bin from CPL and CALIPSO are plotted with altitude (horizontal resolutions of 200 m, 5 km, and 5-20-80 km). For daytime (top left), the CALIPSO cloud area frequencies (blue) are about 20% lower than CPL (red) above 14 km where thin cirrus are detected. For nighttime (top right) and opaque clouds (bottom left), CALIPSO cloud area frequencies (blue) are about 5% to 20% higher than CPL (red). There is good agreement between the 2 instruments for transparent cloud layers (bottom right) below 14 km where thick but transmissive cirrus clouds are located. Laboratory for Atmospheres
Name: John E. Yorks, NASA/GSFC, Code 613.1 and SSAI E-mail: John.E.Yorks@nasa.gov Phone: 301-614-6284 References: Yorks, J. E., D. Hlavka, M. Vaughan, M. McGill, S. Rodier, and W. Hart (2011), Airborne Validation of Cirrus Cloud Properties Derived from CALIPSO Lidar Measurements, Part I: Spatial Properties, Journal of Geophysical Research, submitted. McGill, M. J., M. A. Vaughan, C. R. Trepte, W. D. Hart, D. L. Hlavka, D. M. Winker, and R. Kuehn (2007), Airborne validation of spatial properties measured by the CALIPSO lidar, Journal of Geophysical Research, 112, D20201, doi:10.1029/2007JD008768. Data Sources: The 1 km and 5 km horizontal resolution version 3 level 2 Cloud-Aerosol Lidar Infrared Pathfinder Satellite Observations (CALIPSO) cloud layer products; the Cloud Physics Lidar (CPL) optical data products averaged to 1 and 5 km horizontal resolutions; The CPL data was collected during the CALIPSO/CLOUDSat Validation Experiment (CC-VEX) conducted from 26 July to 14 August 2006 from Atlanta, GA. Technical Description of Figures: Figure 1. Cloud area detection frequency per range bin from CPL and CALIPSO normalized to the total number of range bins in all coincident overpasses during the CC-VEX project are plotted with altitude. The CPL cloud area frequencies at horizontal resolutions of 200 m (dashed red) and 5 km (solid red) are compared to the CALIPSO cloud area frequencies at horizontal resolutions of 5 km (solid blue) and 5-80 km (dashed blue). For daytime (top left) cloud layers below 11 km, there is good agreement between the 5 km cloud area frequencies of the 2 instruments. However, CALIPSO 5 km cloud area frequencies (solid blue) above 13 km are 5-20% lower than CPL 5 km cloud area frequencies (solid red). The higher noise in the CALIPSO instrument inhibits detection of optically thin cirrus clouds in comparison to CPL, especially during daytime hours. This occurs in 4.6% of total range bins. When the CALIPSO noise is decreased by using resolutions of 5-20-80 km to detect cloud layers (dashed blue), the CALIPSO frequencies are in much better agreement with the CPL 5 km cloud boundaries (red). For nighttime (top right) cloud layers above 14 km, there is excellent agreement between the 5 km cloud area frequencies of the 2 instruments. However, CALIPSO 5 km cloud area frequencies (solid blue) below 14 km are 25% higher than CPL 5 km cloud area frequencies (solid red). This is attributed to multiple scattering effects in the CALIPSO signal which causes CALIPSO frequencies to be higher than CPL for opaque clouds (bottom left) and differences in the layer detection algorithms applied to measurements by the 2 instruments. These 2 issues account for about 6% of measurements. There is good agreement between the 2 instruments for transparent cloud layers (bottom right) below 14 km where thick cirrus clouds are located. For high (above 13 km) optically thin clouds, CALIPSO 5 km cloud area frequencies (solid blue) are 5-10% lower than CPL 5 km cloud area frequencies (solid red). This is attributed to higher noise in the CALIPSO measurement. Overall, these results suggest that the uncertainty in the CALIPSO cloud layer detection is 5-10%. Scientific significance: The CALIPSO data products have a large range of applications to significant climate system studies, such as developing global cloud statistics, initializing global cloud models and investigating cloud-aerosol interactions and radiative effects. Therefore, the validation of the CALIPSO data products is crucial in quantifying uncertainties and detecting biases in the retrievals and should in turn strengthen the results of previous and future studies using CALIPSO data. Relevance for future science and relationship to Decadal Survey: The successful launch of the CALIPSO satellite in April 2006 has provided the science community a five-year global data set of cloud and aerosol properties in the Earth’s atmosphere. The primary payload aboard CALIPSO is the Cloud-Aerosol Lidar with Orthogonal Polarization (CALIOP), a dual wavelength elastic backscatter lidar. Reliable layer detection in the standard data products of this lidar instrument is essential for the accurate derivation of layer optical properties, as well as the application of physical and optical properties resolved by the CALIOP system. Laboratory for Atmospheres
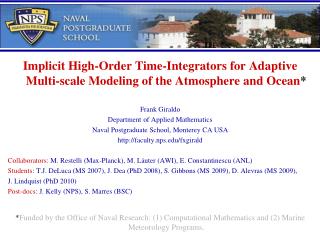
First large-scale Demonstration of Aerosol-cloud interactions increasing Cloud FractionTianle Yuan, L. A. Remer, H. Yu, Code 613.2, NASA GSFC Sulfur dioxide gases vented out of volcanoes can turn into tiny sulfate particles in the atmosphere, called aerosols. Aerosols are an essential ingredient for cloud formation and their amount can significantly change cloud properties. Kilauea is a volcano on the Big Island of Hawaii and it was constantly emitting sulfur dioxide gases during the summer of 2008. The resulting aerosol particles are observed from MODIS to form a large-scale plume (Figure 1A) downwind of the Hawaiian Islands. We show that these aerosol particles decrease cloud droplet size, increase cloud brightness, and ultimately enhance cloud fraction. For the first time we are able to observe large-scale increase in cloud fraction resulting from aerosol-cloud interactions. This is only possible with observations by a suite of instruments onboard the NASA A-Train satellites. The theory and observational evidence are detailed in Yuan et al. (2011) and can be summarized in the following chain reaction: aerosols increase the number of cloud droplets and decrease their sizes, suppress drizzle formation, make clouds brighter and larger and finally increase cloud coverage. Direct satellite observations suggest as much as 20Wm-2 more solar energy is reflected back to space as a result of aerosol increasing cloud brightness and coverage. Figure 1: Large aerosol plume (A) results from SO2 degassing out of the Big Island, Hawaii. Enhancement of cloud optical depth (B), decrease of cloud droplet size (C) and increase of cloud fraction (D) as result of trade cumulus clouds interacting with volcanic aerosol (A). For the first time we have evidence of large-scale increase in cloud fraction (D) due to aerosol-cloud interaction. Laboratory for Atmospheres
Name: Tianle Yuan, NASA/GSFC Code 613.2 and UMBC/JCET E-mail: tianle.yuan@nasa.gov Phone: 301-614-6195 References: Yuan, T., Remer, L. A., and Yu, H. (2011): Microphysical, macrophysical and radiative signatures of volcanic aerosols in trade wind cumulus observed by the A-Train, Atmos. Chem. Phys. Discuss., 11, 6415-6455, doi:10.5194/acpd-11-6415-2011 Data Sources: MODIS level 2 and level 3 aerosol product; MODIS level 2 and level 3 cloud product; CloudSat precipitation and radar reflectivity; CALIOP backscatter and feature mask product; Aqua CERES broadband flux product Technical Description of Figures: Figure 1: Large aerosol plume (A) results from SO2 degassing out of Big Island, Hawaii. Enhancement of cloud optical depth (B), decrease of cloud droplet size (C) and increase of cloud fraction (D) as result of trade cumulus clouds interacting with volcanic aerosol (A). For the first time we have evidence of large-scale increase in cloud fraction (D) due to aerosol-cloud interaction. Scientific significance: Aerosol effect on cloud coverage has been hypothesized for more than 20 years. Our results are among the first observational evidence that demonstrate this effect at a process level. These observations provide the anchor for climate models to appropriately model this aerosol effect. The strong radiative forcing due to aerosol effect on cloud coverage needs to be considered to better understand past climate change as well as project future climate. The strong sensitivity of cloud radiative forcing to aerosols in the trade cumulus regime also offers a new potential geoengineeringsolution to mitigate warming in the case of emergency. Relevance for future science and relationship to Decadal Survey: Aerosol-cloud-precipitation interactions are a key set of unresolved processes in our understanding of the climate system. They are also a critical component of the Decadal Survey’s Aerosol-Cloud-Ecosystem (ACE) mission and a major goal for future NASA missions. Laboratory for Atmospheres
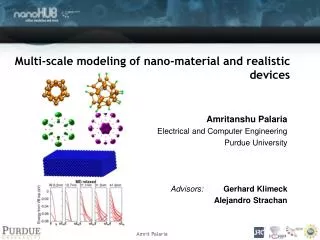
A New Satellite-based Technique for Measuring Aerosols Above CloudsOmar Torres, P.K. Bhartia Code 613.3, NASA GSFC HirenJethva, Hampton University Aerosols are tiny particles, such as smoke, soil dust, and sea salt, suspended in the atmosphere. They scatter and absorb solar radiation and play an important role in the energy balance of the earth-atmosphere system. Carbonaceous particles produced by biomass burning and boreal forest fires, and desert dust particulates originating in arid and semi-arid regions are the most predominant absorbing aerosol types, and lead to atmospheric heating. A large fraction of the atmospheric aerosol load reaches the free troposphere and is frequently located above clouds. A variety of well established space and ground based techniques are used to measure the amount (i.e., optical depth) of suspended particle matter under cloud-free conditions. Aerosol above clouds, however, can only be measured from airborne or satellite-based instrumentation. We have developed a method to measure the optical depth of absorbing smoke and dust aerosols located above clouds using satellite observations of upwelling radiation at two wavelengths in the near-UV spectral range (330-390 nm). The technique takes advantage of the particle’s large absorption capacity of cloud reflected radiation to detect and quantify particulate matter above clouds. Figure 1: An absorbing aerosol layer as seen from space by two satellite sensors on August 4, 2007 over the South Atlantic Ocean off the coasts of Angola and Namibia : Aqua-MODIS visible image of an extended low level cloud (left); Aura-OMI detection of a smoke layer above clouds in terms of the UV aerosol index, a measure of aerosol scattering/absorption. The new satellite-based measuring technique will facilitate the study of several aspects of aerosol-cloud interaction and the accurate quantification of the direct radiative forcing effects of absorbing aerosols above clouds. Figure 2: Derived aerosol optical depth field (388 nm) corresponding to the aerosol layer in Figure 1. Laboratory for Atmospheres
Name: Omar Torres, NASA/GSFC, Code 613.3 E-mail: omar.o.torres@nasa.gov Phone: 301-614-6776 References: Torres, O., H. Jethva, and P.K. Bhartia (2011), Retrieval of Aerosol Optical Depth above clouds from OMI observations: sensitivity analysis and case studies, Journal of the Atmospheric Sciences, (submitted). Torres, O., A. Tanskanen, B. Veihelman, C. Ahn,R. Braak, P. K. Bhartia, P. Veefkind, and P. Levelt (2007), Aerosols and Surface UV Products from OMI Observations: An Overview, Journal of Geophysical Research.,112, D24S47, doi:10.1029/2007JD008809. Data Sources: Aura satellite Ozone Monitoring Instrument (OMI) spectral radiances data. Technical Description of Figures: Figure 1: The presence of a horizontally extended cloud off the coasts of Angola and Namibia as seen by MODIS is shown on the left. The cloud is about 0.5 km thick and lies between 1.0 and 1.5 km above sea level as indicated by CALIPSO-lidar observations (not shown). The darkening effect associated with aerosol absorption can be observed over the northernmost region of the cloud. The right panel shows the unambiguous presence of an absorbing aerosol seen by the OMI absorbing aerosol index (AAI). According to CALIPSO observations the aerosol layer resides at about 1 km above the cloud. Figure 2: Retrieved 388 nm aerosol optical depth (AOD) of the aerosol layer in Figure 1. The AOD is obtained via an inversion algorithm that makes use of radiative transfer calculations at 354 and 388 nm. Observed values of the AAI and 388 nm reflectance are fed to an inversion scheme that simultaneously derives the optical depths of both the absorbing aerosol layer and the underlying cloud. Assumptions of aerosol type and aerosol-cloud separation are required. Scientific significance: Unlikeaerosols above over dark backgrounds, whose scattering effects exert a net cooling effect on the upwelling radiation at the top of the atmosphere, carbonaceous and dust aerosols above clouds absorb a fraction of the radiation reflected by the cloud and can, thus, produce a net warming effect of the atmospheric column. The magnitude of the resulting warming depends on the aerosol optical depth and its absorption capacity (or single scattering albedo) and the spatial coverage (cloud fraction) of the underlying cloud. The measuring technique developed here provides a very important remote sensing tool to accurately quantify the atmospheric aerosol load above clouds. The improved AOD estimates will allow a better characterization of the direct radiative forcing of above-cloud-aerosols, and a better understanding of other aspects of aerosol-cloud interaction. Relevance for future science and relationship to Decadal Survey: Satellite remote sensing of aerosols and clouds combining near IR, visible and near UV observations offer a great potential for the study of aerosol-cloud interaction. The near-UV aerosol sensing capability was developed based on TOMS observations and is currently applied to OMI measurements. The NPP-OMPS sensor and the planned DS Geo-CAPE mission will continue the long-term record of near-UV aerosol observations. Laboratory for Atmospheres