Download
1 / 22
220 likes | 313 Views
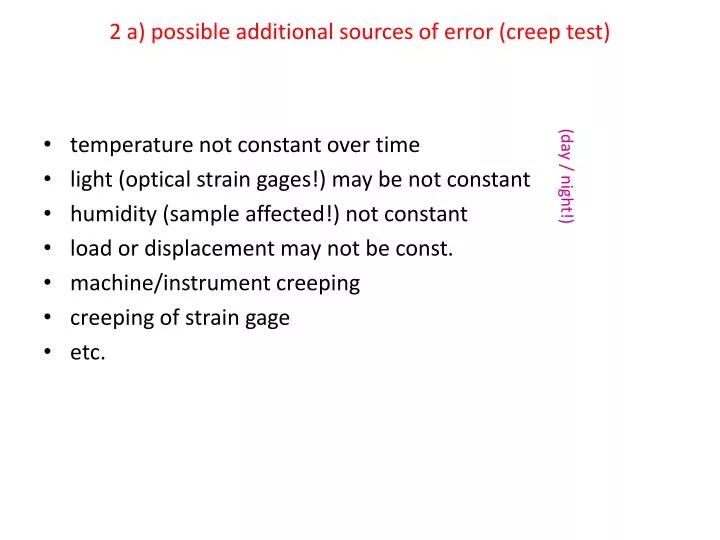
2 a) possible additional sources of error (creep test). temperature not constant over time light ( optical strain gages !) may be not constant humidity (sample affected !) not constant load or displacement may not be const . machine / instrument creeping creeping of strain gage

E N D
2 a) possible additional sources of error (creep test) • temperature not constantover time • light (opticalstraingages!) maybe not constant • humidity (sample affected!) not constant • loadordisplacementmay not beconst. • machine/instrumentcreeping • creepingofstraingage • etc. (day / night!)
2 b) Analyzing a creep experiment tertiary secondary primary
creepcompliance notethatthevaluesofearegiven in %, so youhavetodividethemby 100 to evaluatecreepcomplianceisonlyuseful in thesecondaryregion (markedby ) D is in therangeof 1/MPa
2 c) i. result: mastercurveat 120°C mastercurveat 120°C
2 c) ii. predictcompliance after 5 days mastercurveat 120°C
mastercurveat 120°C 5 d = 5*24*60 min = 7200 min
D(5 d) ≈ 1/psi mastercurveat 120°C 5 d = 5*24*60 min = 7200 min
2 c) iii. possiblepredictionrangeat 120°C mastercurveat 120°C
mastercurveat 120°C 40000 min = = 0,9 months = = 0,1 years
forcomparison: possiblepredictionrangeat 90°C mastercurveat 90°C 3e+9 min = = 70000 months = = 5700 years
3. Fatiguetesting a) threeexamplesofapplicationscyclic stress loading wingsofairplanes turbine blades rotor blades (nicht sehr schwer, wenn zwei davon schon in b) genannt sind)
b) Wöhler curveandestimationoflife time (aim: toshowthatcyclicloadedcomponents must havehugesafety factors, iffatiguetestingis not performed) i. N(40 MPa) ≈ 9000 ii. N(27 MPa) ≈ 300000 i. N(40 MPa) ≈ 9000 tlife = N/f = 9000 * 1 / 0,5 s = 18000 s = = 5 hours ii. N(27 MPa) ≈ 300000 tlife = N/f = 300000 * 1 / 1000 s = 300 s = = 5 minutes