Download
1 / 10
100 likes | 316 Views
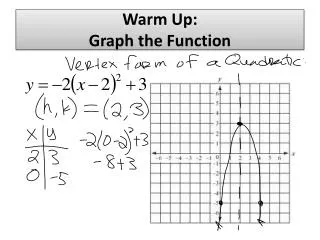
Warm Up: Graph the function. Give the Domain, Range, and any Asymptotes. 5 -2 Graphing Simple Rational Functions. What do Rational Functions look like?. Def: A function in the form Where q(x)≠0. Note: p(x) and q(x) are polynomials. Finding Asymptotes:. For Variables in only the denom :.

E N D
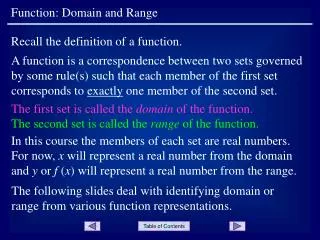
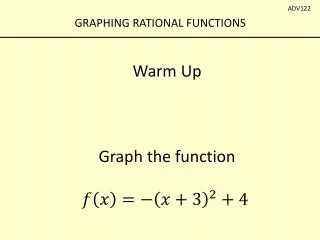
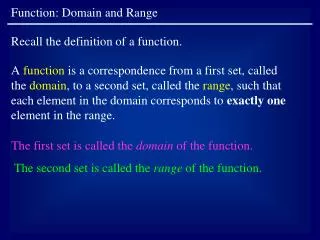
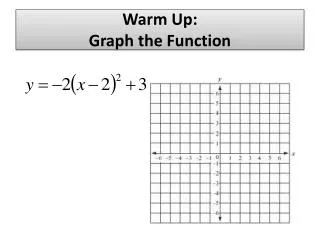
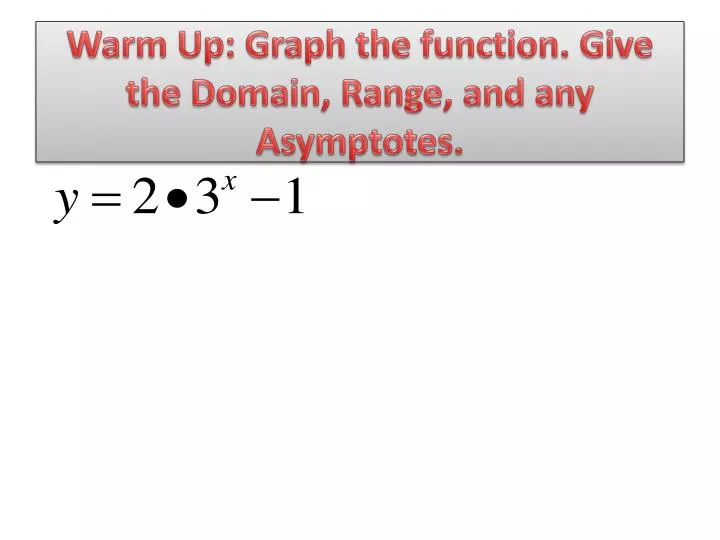
Warm Up: Graph the function. Give the Domain, Range, and any Asymptotes.
What do Rational Functions look like? Def: A function in the form Where q(x)≠0. Note: p(x) and q(x) are polynomials.
Finding Asymptotes: For Variables in only the denom: Hor. Asympt: Whatever we are adding or subtracting outside the fraction. Ver. Asympt: The solution when the denom. is set equal to 0.
Finding Asymptotes: For Variables in the denom. and the numer: Hor. Asympt: Ver. Asympt: The solution when the denom. is set equal to 0.
Ex 1: Graph the function. State the domain and range. y Step 1: Identify the Ver. and Hor. Asymptotes x Horizontal Asympt. Set denom. Equal to 0 to find the Ver. Asympt. : x+1 = 0 x = -1
Ex 1: Graph the function. State the domain and range. y Step 2: Use a table to find points in between the Asymptotes. x 2 Note: pick 2 points on either side of the Ver. Asymptote 1 5 4
Ex 1: Graph the function. State the domain and range. y Domain: All real numbers except -1 Range: All real numbers except 3 x
Ex 2: Graph the function. State the domain and range. y Hor. Asympt. for Variables in Denom. and Numerator: x 2x+4 = 0 Vertical Asym. At x=-2
Ex 2: Graph the function. State the domain and range. y ¾ x 1 0 ¼ Domain: All real numbers except -2 Range: All real numbers except ½