Download
1 / 51
510 likes | 614 Views
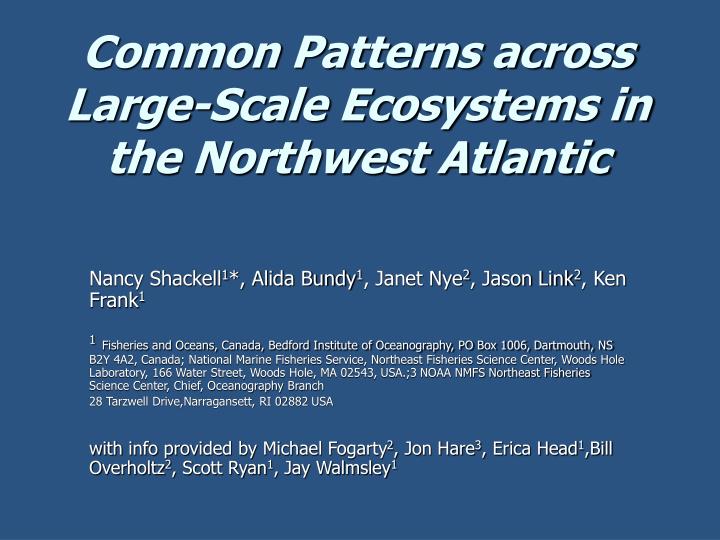
Common Patterns across Large-Scale Ecosystems in the Northwest Atlantic. Nancy Shackell 1 *, Alida Bundy 1 , Janet Nye 2 , Jason Link 2 , Ken Frank 1

E N D
Common Patterns across Large-Scale Ecosystems in the Northwest Atlantic Nancy Shackell1*, Alida Bundy1, Janet Nye2, Jason Link2, Ken Frank1 1Fisheries and Oceans, Canada, Bedford Institute of Oceanography, PO Box 1006, Dartmouth, NS B2Y 4A2, Canada; National Marine Fisheries Service, Northeast Fisheries Science Center, Woods Hole Laboratory, 166 Water Street, Woods Hole, MA 02543, USA.;3 NOAA NMFS Northeast Fisheries Science Center, Chief, Oceanography Branch 28 Tarzwell Drive,Narragansett, RI 02882 USA with info provided by Michael Fogarty2, Jon Hare3, Erica Head1,Bill Overholtz2, Scott Ryan1, Jay Walmsley1
Outline: -Broad Scale Ecosystem Analysis (1967-2008)—What are Common Signals? - Context: Climate and Fishing Work together BUT Fishing>>local Climate in Heavily Fished Systems on Broad Spatial scales (i.e. can’t detect subtleties) -Broad-Scale analysis can inform CLIMATE CHANGE ADAPTATION POLICY: Fishing => modifies ability to buffer climate change (demographics, space, diversity)
Climate IMPACTS Ecosystem Integrity Economic Implications DRIVERS/PRESSURE RESPONSES Policy and Legislation Programs and Initiatives -EAM framework -Adaptation Policy STATE Trophic Structure Size Structure
How are DRIVERs correlated to trends ? Climate 5 Temp Indices 1 Stratification 3 Temperature CV 2 Water Mass Indices Fishing \ 1-Resource Potential Climate 6 fxnl grps 3 fxnl grps of Inverts 6 fxnl grps of 45 fish spp. e.g. Herring=Planktivore; Cod, Haddock, Pollock=Predatory Grdfish 5 indices of Average Fish Size 1 Dominance 1 index Fishing Size MacroInverts STATE Extract trend from multiple time series…for each region (~ 22 vars/region)
Summarize Multiple Variables into ONE Trend • Principal component analysis especially for time series. • MAFA (min/max autocorrelation factor analysis; Solow, A.R. 1994 Biometrics50, 556-565) • A method to extract trends from multiple time series
Major Trend of STATE indices: NESW Monotonic Trend in thru 80’s to 1990 But ….which variables contribute most to trend?
What are common signals among regions? (Focus on continuous time series in all regions)
Are Common Drivers (Climate, Fishing) Associated with Trends?
Strongest Commonality thru 80’s …then abating in 90’s • Base of Food Chain Increase (where measured) • Planktivore Increase • Fish Size Decline • Fish Biomass Decline
SO FAR- Common Patterns associated with Large-scale Forcing=Atlantic Multidecadal Oscillation What is the AMO? AMO =Phases of SST in North Atlantic - cool and warm phases ~ 20-40 years (diff about 1°F btwn extremes). - natural and associated with circulation -overlap with our study? Late 60’s …what is mechanism btwn AMO and local Climate? (Drinkwater 2010) …should be pursued.
NF: Fishing predators/Seal predation/Climate Baltic Sea Trophic Cascade: Decline in Top Predators; Changing Climate WSS Black Sea sGSL ESS Upper Trophic Levels? Lots of Evidence for Fishing as Primary Influence ~abetted by Climate
Major Groundfish Under moratoria Since 1992/93 .. But periodically re-opened …extant Over the past 10 yrs…Emerging Global Patterns in Trophic Structure: • DECLINE in Predatory Groundfish BIOMASS or SIZE INCREASE in Prey(e.g. Schmitz et al., 2000; Berger et al., 2001; Worm & Myers, 2003; Bascompte et al., 2005; Bowyer et al.; 2005, Terborgh et al., 2007). • ….. Large-scale oceanographic variability can either exacerbate a trophic imbalance, or initiate a change in lower trophic levels (e.g. Benoit & Swain, 2008; Cloern et al. 2007; Pershing et al. 2005; Beaugrand et al. 2008).
FISHING Climate ...setting the stage
Fishing? Or Climate?.. ..Interaction…Effects of climate and exploitation can’t really be separated (Journal of Marine Systems 79 (2010))
Climate-Change Adaptation ==recognize risk for recovering groundfish populations • Fishing • affects structure of populations and ecosystems • modifies ability to buffer climate change (demographics, space, diversity) Journal of Marine Systems 79 (2010) • Example of Declining body size
Decline in: Biomass, Size and/or spatial contraction==Decreased Buffering Capacity thru Effcts on productivity and pop’n connectivity
Summary: • Broad-Scale Analysis ==Common Trends among regions • Fishery Effects Consistent with Common Trends • Can Identify Good Questions to address Climate/Fishery Interactions • Fishery Effect modifies Response to Climate Change • identify risk for recovering groundfish populations
Broad Picture obscures details— For e.g. • we didn’t lag any of the Climate Indices (b/c different trophic levels would have different scales) …to tease apart climate mechanisms, also have to look at individual components-vis a vis lag effects.
Why the changes? • – Increased stratification? • - Pred/Prey Dynamics? • -Major pt= • our broad-scale analysis (by virtue of datasets) cannot id mechanisms if main signal is dominated by fishing WSS- 90s 00s Phytoplankton Index 70s 60s Erica Head
[Herring] …. are one of the healthiest fish … full of omega-3 oils ….. A few years ago, the oldest person in the world, a hundred-and-fourteen-year-old Dutch woman, said she attributed her longevity to eating pickled herring every day. (A hundred-and-fourteen-year-old woman from Texas attributed her long life to “minding my own business.”)Oliver Sacks in New Yorker, 2009 on the wonders of Herring. • Read more: http://www.newyorker.com/talk/2009/07/20/090720ta_talk_sacks#ixzz0fd2ojv3B
Climate-Change Adaptation==recognize risk for recovering groundfish populations • -Smaller species (either naturally, or thru change in life history traits) respond more quickly to changing climates (thru shorter generation times and abitlity to take advantage of favourable environments or to succumb to unfavourable environments • (Body-size dependent responses to climate change, Genner et al. 2010 Global Change Biology 16:517-527) • Smaller spp go thru boom bust HIGHER RISK
Model Development -BASED ON Positive Covariance among variables INDEPENDENT (because of collinearity) 1-Top Predator Body Size= PC1 of (Predator Mean Weight, Condition, Growth) 2-Oceanographic = PC1 of (Temp100m, SST, Sal0,Sal100m) 3-Stratification Where RESPONSE Aggregate Prey Biomass Size, Condition Growth Stratification Temp 100m SST Salinity 100m SSS
Summary of Common Trends In General-common signals in ESS, WSS, BoF, GoMa, ~GB RESPONSE • Planktivore /MacroInvertebrate INCREASE thru 80’s • Main Predator BM declined/steady/or increased late in time series (mixed bag) • Main Predator Size decline thru 80’s DRIVERS/PRESSURES: • AMO (now in warm phase) and Fishing associated with Trends- • magnitude of association varies with region
Warming and Resource Availability Shift Food Web • Structure and Metabolism • Mary I. O’Connor1,2¤*, Michael F. Piehler3, Dina M. Leech3, Andrea Anton1,2, John F. Bruno2 • 1 Curriculum in Ecology, The University of North Carolina, Chapel Hill, Chapel Hill, North Carolina, United States of America, 2 Department of Marine Sciences, The • University of North Carolina, Chapel Hill, Chapel Hill, North Carolina, United States of America, 3 Institute of Marine Sciences, Morehead City, North Carolina, United States • of America • Abstract • Climate change disrupts ecological systems in many ways. Many documented responses depend on species’ life histories, • contributing to the view that climate change effects are important but difficult to characterize generally. However, • systematic variation in metabolic effects of temperature across trophic levels suggests that warming may lead to • predictable shifts in food web structure and productivity. We experimentally tested the effects of warming on food web • structure and productivity under two resource supply scenarios. Consistent with predictions based on universal metabolic • responses to temperature, we found that warming strengthened consumer control of primary production when resources • were augmented. Warming shifted food web structure and reduced total biomass despite increases in primary productivity • in a marine food web. In contrast, at lower resource levels, food web production was constrained at all temperatures. These • results demonstrate that small temperature changes could dramatically shift food web dynamics and provide a general, • species-independent mechanism for ecological response to environmental temperature change.
Predator Size Planktivore Biomass Do larger predators regulate their prey more efficiently?
DRIVING FORCES Oceanography Climate Change Economic Activity RESPONSES Policy and Legislation Programs and Initiatives -EAM framework -Adaptation Policy PRESSURES Fishing Activity Oil and Gas Activity Aquaculture IMPACTS Ecosystem Integrity Economic Implications STATE Trophic Structure Size Structure
Next Steps. • What does the AMO mean?—What is mechanism? • Underlying mechnism can only be elucidated by knowing how large-scale forcing affects local variation (Drnkwater et al. 2010 confounded by strong autocorrelation…. The research on the AMO is not well developed yet, for eg., the NAO, in the NW Atlantice can have diffeent effects on both the E and WSS • Ecosystem Response is Contextual: Impact of climate /fishing is exacerbated at higher latitudes • NORTH (ESS): Response to the two main drivers is stronger =Trophic Cascade • SOUTH (MAB) – no drivers very strong - Other drivers may be more important • Mid RANGE (WSS, GoM, BoF,~GB) : Increase in Planktivores, decline in predator biomass in some areas, and decline in size… ….Reduction in Main Predator Size Predatory impact of main predators declined due to reductions in body size that facilitated an increase in prey
Exploitation alters structure of populations and ecosystems modifies ability to buffer climate change • 1) Demographic effects of fishing (removal of large-old individuals) can have substantial consequences on the capacity of populations to buffer climate variability through various pathways (direct demographic effects, effects on migration, parental effects). • 2) Selection of population sub-units within metapopulations may also lead to a reduction in the capacity of populations to withstand climate variability and • change. • 3) At the ecosystem level, reduced complexity by elimination of species, such as might occur by fishing, may be destabilizing and could lead to reduced resilience to perturbations. Differential exploitation of marine resources could also promote increased turnover rates in marine ecosystems, which would exacerbate the • effects of environmental changes. Overall
PRINCIPAL COMPONENTS OVER TIME Rerun with InvGrs