Download
1 / 3
30 likes | 183 Views
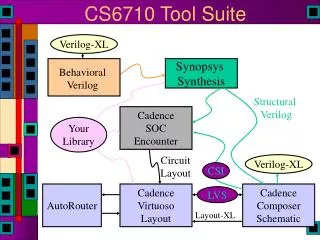
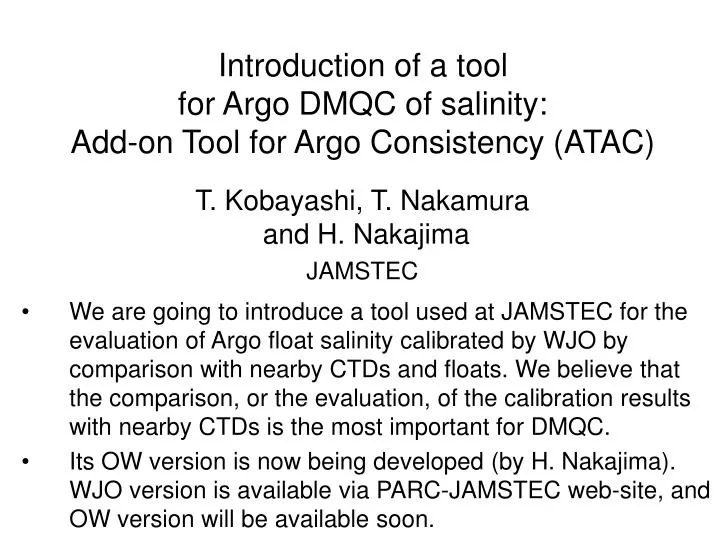
Introduction of a tool for Argo DMQC of salinity: Add-on Tool for Argo Consistency (ATAC). T. Kobayashi, T. Nakamura and H. Nakajima JAMSTEC.

E N D
Introduction of a tool for Argo DMQC of salinity:Add-on Tool for Argo Consistency (ATAC) T. Kobayashi, T. Nakamura and H. Nakajima JAMSTEC • We are going to introduce a tool used at JAMSTEC for the evaluation of Argo float salinity calibrated by WJO by comparison with nearby CTDs and floats. We believe that the comparison, or the evaluation, of the calibration results with nearby CTDs is the most important for DMQC. • Its OW version is now being developed (by H. Nakajima). WJO version is available via PARC-JAMSTEC web-site, and OW version will be available soon.
Apply ATAC for a calibration by WJO Colour: distance from the float Red: within 50x50km Yellow: within 125x250km Blue: within 250x500km Symbol Triangle: CTD Square: DMQCed float Star: RTQCed float Note: JAMSTEC uses WJO for DMQC calibration. BS and OW are operated additionally to evaluate the results of WJO.
ATAC for OW results (under development) Colour:Weighting factor used in OW Pink: – 0.2 Yellow: 0.2 – 0.5 Blue: 0.5 – of the smaller scale (including temporal factor). Symbol:Location of nearby data ○: North-East ward from float position △: North-West ward □: South-West ward ☆: South-East ward Here, float data in the Colioris reference are plotted only.It is possible to plot your “private” CTDs (even not used in OW) by ATAC.