Download
1 / 16
180 likes | 356 Views
Metrics for Model Skill Assessment. Model Error time series (model-data misfit): ME(i) = model - data Total Root-Mean-Square Error: RMS_Total RMS_Total 2 = RMS_Bias 2 + RMS_Variability 2 RMS_Bias = difference between means RMS_Variability (centered pattern RMS) =

E N D
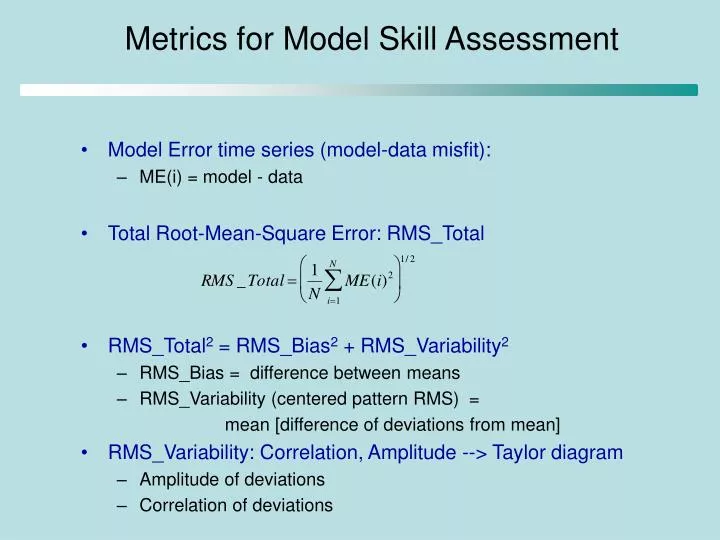
Metrics for Model Skill Assessment • Model Error time series (model-data misfit): • ME(i) = model - data • Total Root-Mean-Square Error: RMS_Total • RMS_Total2 = RMS_Bias2 + RMS_Variability2 • RMS_Bias = difference between means • RMS_Variability (centered pattern RMS) = mean [difference of deviations from mean] • RMS_Variability: Correlation, Amplitude --> Taylor diagram • Amplitude of deviations • Correlation of deviations
Taylor Plot Graphical relationship between time series based on four statistics: 1) Overall Mean Bias 2) Seasonal Variance Standard Deviation 3) Timing/Phase Correlation Coefficient 4) Root Mean Square Error Centered RMS Distance (RMS_V)
new Run 801 old Run 751
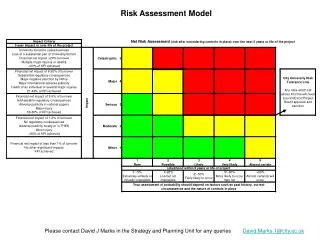
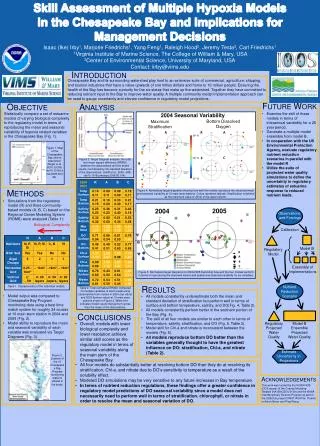
Target Diagram as Skill Assessment Tool RMS_T2 = RMS_B2 + RMS_V2 SAB SST climatology model-data misfit = variability in data model-data misfit = error in data
Summary Taylor & Target diagrams are two complimentary ways of assessing model skill - Taylor: Correlation of variability Amplitude of variability (Bias) - Target: Total RMS Relative bias and variability components
Summary (cont.) • SST • Correlation: ~0.9 always satellite, in situ, 2004, climatology • Amplitude of variability: good especially for satellite 2004 comparisons underestimate in FL, GA overestimate everywhere north of SC • Bias: low underestimate in SAB in climatology, better using 2004 • RMS_bias ≈ RMS_variability • MLD • Correlation: always positive Higher in MAB (.8) than SAB (.5) Higher in outer SAB (>.6) than inner SAB (<.4) • Amplitude of variability: overestimate variability Except for MAB Outer shelf • Bias: generally low typically overestimate (FL inner, DE outer) occasionally underestimate (FL, GA outer, MAB outer)
Summary (cont.) • Surface chlorophyll - much greater challenge! • Correlation: -0.6 to 0.9 (same for Clim and 2004) lower off NC, SC, NY Higher off FL, DE, NJ • Amplitude of variability: so-so (worse for 2004 in SAB) underestimate in SAB overestimate in MAB • Bias: large negative bias everywhere underestimate in GA, SC (benthic production?) underestimate on inner MAB shelf • RMS_bias >> RMS_variability • Little correlation between where MLD/SST is modeled well (poorly) and where chlorophyll is modeled well (poorly)
Future Work • Use these Taylor/Target diagrams to compare runs • With/without tides • With/without DOM • Plot other quantities: • kPAR, productivity, oxygen, salinity • Examine other regions: • Gulf of Maine • Gulf Stream/Sargasso • Use these for the OCRT meeting? • Use these for the Oceanography article?