Download
1 / 28
280 likes | 437 Views
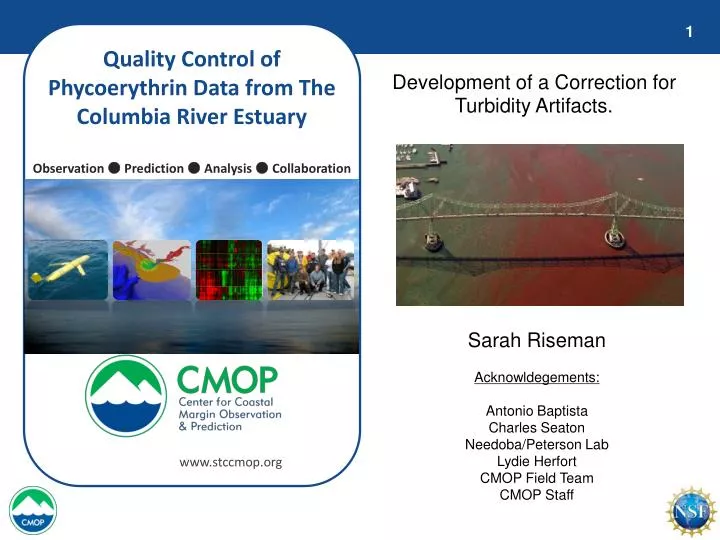
Quality Control of Phycoerythrin Data from The Columbia River Estuary. Development of a Correction for Turbidity Artifacts . Observation ● Prediction ● Analysis ● Collaboration. Sarah Riseman Acknowldegements : Antonio Baptista Charles Seaton Needoba /Peterson Lab Lydie Herfort

E N D
Quality Control of Phycoerythrin Data from The Columbia River Estuary Development of a Correction for Turbidity Artifacts. Observation ● Prediction ● Analysis ● Collaboration Sarah Riseman Acknowldegements: Antonio Baptista Charles Seaton Needoba/Peterson Lab LydieHerfort CMOP Field Team CMOP Staff www.stccmop.org
Background: phycoerythrin • Chemotaxonomic pigment • Synechococcus spp. • Cryptophytes • Myrionecta rubra** • Measured using Fluoromtry • Autofluorescent: fluorometers designed with filter sets to specifically measure the presence of phycoerythrin • Turbidity & temperature are two sources of bias of in situ fluorometric measurements
Background: Basics of a Filter Fluorometer Adapted from:http://www.turnerdesigns.com/t2/doc/appnotes/998_0050/0050_c3.html
Chlorophyll & Phycoerythrin Spectral Properties Chlorophyll a 460 620 - 715 Phycoerythrin 523 578
SATURN-03 Data from 2m (July 2010 – March 2011) Turbidity Raw Phycoerythrin Chlorophyll
Combined Turbidity Correction Turbidity Corrected Phycoerythrin Chlorophyll
Preliminary Turbidity Correction Monthly Phycoerythrin vs. Turbidity, Colored by Chlorophyll Saturn03 - 2m Phycoerythrin July August September Turbidity October *November
Preliminary Turbidity Correction time period not used in regression (8/15 – 10/10) Time combined remainder of data into single data set
Preliminary Turbidity Correction – Linear Fits high(225-500ntu) All Data Low (< 225ntu)
Preliminary Turbidity Correction Turbidity Corrected Phycoerythrin Chlorophyll back
Combined Turbidity Correction Turbidity Raw Phycoerythrin Chlorophyll
Details of Correction Determination • Data Selection: • - winter only • - all 3 depths • - chlorophyll < 2 ug/L • turbidity < 625 NTU • 2. Data Binned & Averaged • 1 NTU turbidity bins • data within mean +/- 3 s.d. averaged • 3. Curve Fitted • several evaluated • simplest selected: • Exponential rise to maximum: Single 3 parameter Exponent
New Turbidity Correction Turbidity Corrected Phycoerythrin Chlorophyll
Conclusions • The turbidity corrections need to be periodically evaluated for changes and updated accordingly • With correction, the phycoerythrin data display a clear pattern corresponding to Chlorophyll • These data clearly identified the onset of the 2010 M. rubra bloom • With field samples a calibration to cell abundance should be possible
Discussion Topics: where do we go from here? • Are the corrected data useful? - Can they be used to monitor the onset & development of M. rubra blooms in the CRE? • How do we validate these signals? - field sampling sampling - monitoring sensor drift
Phycoerythrin/Turbidity Relationship Over Time RE-PLAY JULY 2010 – MARCH 2011 JULY AUGUST SEPTEMBER OCTOBER NOVEMBER DECEMBER JANUARY FEBRUARY MARCH
Turbidity Chlorophyll Phycoerythrin - raw
Turbidity Chlorophyll Phycoerythrin - corrected
Phycoerythrin - corrected Salinity
Saturn01 Turbidity Correction based compiled data from 3 depths (2m,8m,13m) where chl < 1.5 ug/L during Aug 4 – Aug 22, 2010) Saturn01 Turbidity Factor Based on Bin/Avg Regression: TF = 1178.4*turb + 1334.1 Corrected PE = PE – TF (+2850 to raise to raw data baseline)