Download
1 / 1
10 likes | 127 Views
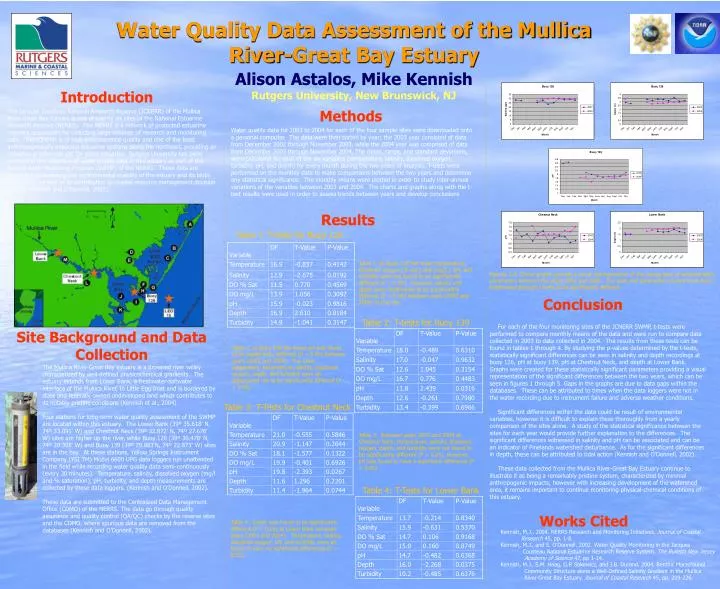
Water Quality Data Assessment of the Mullica River-Great Bay Estuary Alison Astalos, Mike Kennish Rutgers University, New Brunswick, NJ. Introduction. Methods.

E N D
Water Quality Data Assessment of the Mullica River-Great Bay Estuary Alison Astalos, Mike Kennish Rutgers University, New Brunswick, NJ Introduction Methods The Jacques Cousteau National Research Reserve (JCNERR) of the Mullica River-Great Bay Estuary is one of twenty six sites of the National Estuarine Research Reserve (NERRS). The NERRS is a network of protected estuarine reserves responsible for collecting large volumes of research and monitoring data. The JCNERR is of high environmental quality and one of the least anthropogenically impacted estuarine systems along the northeast, providing an exceptional reference site for other estuaries. Rutgers University has been involved in the collection of water quality data in this estuary as part of the System-wide Monitoring Program (SWMP) of the NERRS. These data are important to assessing the environmental stability of the estuary and its biotic community, as well as its contribution to coastal resource management decision makers (Kennish and O’Donnell, 2002). Results Table 1: T-tests for Buoy 126 Table 1. At Buoy 126 the mean temperature, dissolved oxygen (% sat.) and (mg/L), pH, and turbidity were not found to be significantly different (P > 0.05). However, salinity and depth were determined to be significantly different (P < 0.05) between years (2003 and 2004) at this site. Figures 1-5. These graphs provide a visual representation of the comparison of selected site’s parameters between the years 2003 and 2004. The sites and parameters chosen have been determined through t-tests to be significantly different Conclusion Table 2: T-tests for Buoy 139 For each of the four monitoring sites of the JCNERR SWMP, t-tests were performed to compare monthly means of the data and were run to compare data collected in 2003 to data collected in 2004. The results from these tests can be found in tables 1 through 4. By studying the p-values determined by the t-tests, statistically significant differences can be seen in salinity and depth recordings at buoy 126, pH at buoy 139, pH at Chestnut Neck, and depth at Lower Bank. Graphs were created for these statistically significant parameters providing a visual representation of the significant differences between the two years, which can be seen in figures 1 through 5. Gaps in the graphs are due to data gaps within the databases. These can be attributed to times when the data loggers were not in the water recording due to instrument failure and adverse weather conditions. Significant differences within the data could be result of environmental variables, however it is difficult to explain these thoroughly from a yearly comparison of the sites alone. A study of the statistical significance between the sites for each year would provide further explanation to the differences. The significant differences witnessed in salinity and pH can be associated and can be an indicator of Pinelands watershed disturbance. As for the significant differences in depth, these can be attributed to tidal action (Kennish and O’Donnell, 2002). These data collected from the Mullica River-Great Bay Estuary continue to illustrate it as being a remarkably pristine system, characterized by minimal anthropogenic impacts; however with increasing development of the watershed area, it remains important to continue monitoring physical-chemical conditions of this estuary. Site Background and Data Collection Water quality data for 2003 to 2004 for each of the four sample sites were downloaded onto a personal computer. The data were then sorted by year; the 2003 year consisted of data from December 2002 through November 2003, while the 2004 year was comprised of data from December 2003 through November 2004. The mean, range, and standard deviations, were calculated for each of the six variables (temperature, salinity, dissolved oxygen, turbidity, pH, and depth) for every month during the two years of analysis. T-tests were performed on the monthly data to make comparisons between the two years and determine any statistical significance. The monthly means were plotted in order to study inter-annual variations of the variables between 2003 and 2004. The charts and graphs along with the t-test results were used in order to assess trends between years and develop conclusions Table 2. At Buoy 139 the mean pH was found to be significantly different (P < 0.05) between years (2003 and 2004). The other parameters: temperature, salinity, dissolved oxygen, depth, and turbidity were all determined not to be significantly different (P > 0.05). The Mullica River-Great Bay estuary is a drowned river valley characterized by well-defined physicochemical gradients. The estuary extends from Lower Bank, a freshwater-saltwater interface of the Mullica River, to Little Egg Inlet and is bordered by state and federally owned undeveloped land which contributes to its notably pristine conditions (Kennish et al., 2004). Four stations for long-term water quality assessment of the SWMP are located within this estuary. The Lower Bank (39º 35.618' N, 74º 33.091' W) and Chestnut Neck (39º 32.872' N, 74º 27.676' W) sites are higher up the river, while Buoy 126 (39º 30.478' N, 74º 20.308' W) and Buoy 139 (39º 29.883'N, 74º 22.873' W) sites are in the bay. At these stations, Yellow Springs Instrument Company (YSI TM) Model 6600 UPG data loggers run unattended in the field while recording water quality data semi-continuously (every 30 minutes). Temperature, salinity, dissolved oxygen (mg/l and % saturation), pH, turbidity, and depth measurements are collected by these data loggers. (Kennish and O’Donnell, 2002). These data are submitted to the Centralized Data Management Office (CDMO) of the NERRS. The data go through quality assurance and quality control (QA/QC) checks by the reserve sites and the CDMO, where spurious data are removed from the databases (Kennish and O’Donnell, 2002). Table 3: T-Tests for Chestnut Neck Table 3. Between years 2003 and 2004 at Chestnut Neck, temperature, salinity, dissolved oxygen, depth, and turbidity were not found to be significantly different (P > 0.05). However, pH was found to have a significant difference (P < 0.05). Table 4: T-Tests for Lower Bank Works Cited Table 4. Depth was found to be significantly different (P < 0.05) at Lower Bank between years (2003 and 2004). Temperature, salinity, dissolved oxygen, pH, and turbidity were all found to have no significant differences (P > 0.05). Kennish, M.J.. 2004. NERRS Research and Monitoring Initiatives. Journal of Coastal Research 45, pp. 1-8. Kennish, M.J., and S. O’Donnell. 2002. Water Quality Monitoring in the Jacques Cousteau National Estuarine Research Reserve System. The Bulletin New Jersey Academy of Science 47, pp 1-14. Kennish, M.J., S.M. Haag, G.P. Sakowicz, and J.B. Durand. 2004. Benthic Macrofaunal Community Structure alone a Well-Defined Salinity Gradient in the Mullica River-Great Bay Estuary. Journal of Coastal Research 45, pp. 209-226.