Download
1 / 43
430 likes | 554 Views
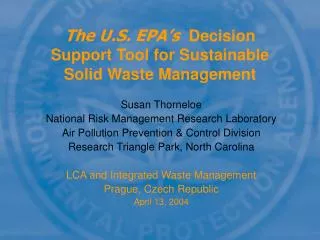
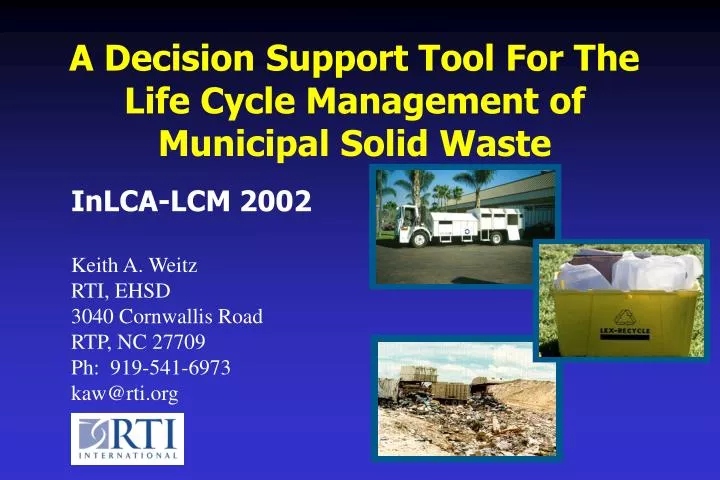
A Decision Support Tool For The Life Cycle Management of Municipal Solid Waste. InLCA-LCM 2002 Keith A. Weitz RTI, EHSD 3040 Cornwallis Road RTP, NC 27709 Ph: 919-541-6973 kaw@rti.org. What is the MSW-DST?.

E N D
A Decision Support Tool For The Life Cycle Management of Municipal Solid Waste InLCA-LCM 2002 Keith A. Weitz RTI, EHSD 3040 Cornwallis Road RTP, NC 27709 Ph: 919-541-6973 kaw@rti.org
What is the MSW-DST? • A computer-based tool developed to analyze cost and life-cycle environmental aspects of municipal solid waste management. • Components of the MSW-DST include: • Process models (MS Excel) • Mass flow model • Optimization routine (Cplex) • User interface (MS Visual Basic)
Types of Questions Answered Using the MSW-DST • What are the cost and environmental benefits of a municipality’s recycling programs? • Which strategy best minimizes GHG emissions for a given budget? • What is the difference in cost and environmental tradeoffs using a landfill bioreactor (or other technology) versus what is currently used? • What are the cost and environmental aspects of recycling versus composting corrugated containers?
Complex Solid Waste Decisions Being Evaluated How do we ensure • Cost efficient waste management? • Meeting state mandated recycling goals? • Continued improvement of the environment? • Fast, objective analysis of options? • Best privatization bids? Environmental Aspects • Local air quality impacts • Energy consumption and offsets • Greenhouse gas emissions • Benefits from materials recycling Economic/Social Aspects • Municipal budgets • Need for new facilities • Household convenience
MSW Decision Support Tool Sound Science + State of the Art Computing Technology Day-to-Day Waste Management Decisions
Main Model Interface The quantity of waste flowing from one process to another is shown in the yellow boxes This screen displays the solution for a model run. The arrows show the origin and destination of waste.
Solution Summary A summary of cost and life cycle environmental results for a model run can be viewed by clicking the “Strategy Summary” button on the previous screen. A graphical display of results is also provided.
Detailed Information Detailed information is also made easily available.
Anderson County, South Carolina Atlanta, Georgia Great River Regional Waste Authority, Iowa Lucas County, Ohio Madison, Wisconsin Minneapolis, Minnesota Portland, Oregon Seattle, Washington Spokane, Washington State of California State of Georgia State of Washington State of Wisconsin Subbor – ETV GHG Center U.S. Conference of Mayors – U.S. GHG Study U.S. Navy Region Northwest Communities Benefiting from the MSW-DST * Many other studies are under consideration and are being funded through participating organizations.
Recent Examples of MSW-DST Applications • National Greenhouse Gas Study • St. Paul, Minnesota • Sound Resource Management (Washington State) • EPA’s New Facility in RTP, NC
National Greenhouse Gas Emissions and Solid Waste Management Examine Effect on Greenhouse Gas (GHG) Emissions in United States Resulting from Local Decisions to Manage Municipal Solid Waste (MSW)
Study Participants • U.S. Conference of Mayors • Integrated Waste Services Association • Research Triangle Institute • U.S. EPA • ICF Consulting • Solid Waste Association of North America • Environmental Industry Associations • Waste Management, Inc.
Principal Findings • American cities have taken actions that have significantly reduced GHG emissions even though quantity of MSW has doubled. • GHG Emissions levels from mid-1970s to current levels have been reduced from 36 to 8 MMTCE per year. • If 1970s technologies were still in use, annual GHG emissions would be approximately 60 MMTCE. • More than 52 MMTCE per year are being avoided through advances in MSW management.
Methodology • Used Decision Support Tool and Life-Cycle Inventory Database to analyze GHG emissions from: • MSW management during the 1970s (earliest available data was for 1974). • MSW management in the subsequent years of 1980, 1990, and 1997 (most recent data available). • National trends used to quantify: • Waste quantities and composition. • GHG emissions from waste management practices.
1980 1974 8% 10% 9% 21% 71% 81% 1990 1997 recycling combustion 16% landfill 27% 16% 56% 68% 17% Technologies Employed
Net GHG Emissions in the U.S. 6.00E+07 5.00E+07 1974 Technology path 4.00E+07 52 million MTCE avoided Metric Tons Carbon Equivalents (MTCE) 3.00E+07 2.00E+07 Actual Integrated Waste Management Technology path 1.00E+07 0.00E+00 1970 1975 1980 1985 1990 1995 2000 Year
Recycling (including composting) Year 1970 1975 1980 1985 1990 1995 2000 0.00E+00 -1.00E+06 1974 Technology path -2.00E+06 -3.00E+06 Metric Tons Carbon Equivalents (MTCE) -4.00E+06 3.2 million MTCE avoided -5.00E+06 Actual Integrated Waste Management Technology path -6.00E+06 -7.00E+06 -8.00E+06
Municipal Waste Combustion Year 1970 1975 1980 1985 1990 1995 2000 0.00E+00 1974 Technology path -1.00E+06 -2.00E+06 5.5 million MTCE avoided Metric Tons Carbon Equivalents (MTCE) -3.00E+06 Actual Integrated Waste Management Technology path -4.00E+06 -5.00E+06 GHG Emissions From MWC -6.00E+06 Note: Negative emissions indicate “savings” in emissions due to energy recovery
Landfills 6.00E+07 1974 Technology path 5.00E+07 44 million MTCE avoided 4.00E+07 Metric Tons Carbon Equivalents (MTCE) 3.00E+07 2.00E+07 Actual Integrated Waste Management Technology path 1.00E+07 0.00E+00 1970 1975 1980 1985 1990 1995 2000 Year
U.S. GHG Emissions Avoided (Year 2000) Increasing Recycling Increasing MWCIncreasing Landfill Gas Controls TOTAL AVOIDED 3.2 MMTCE 5.5 MMTCE 44 MMTCE 52 MMTCE
St. Paul, Minnesota • Goals • Develop an environmental profile of unrecovered paper and food waste composting. • Compare composting to other options ( i.e., municipal waste combustion and landfilling). • Mass Flow (tons/year) Scenario Waste Management Activity Landfill MWC Compost Collection (residential mixed waste) 21,353 21,353 21,353 WTE Combustion 21,300 Compost 21,300 Landfill 21,353 53 1,118 Ash Landfill 1,458
Cost $/year 4,401,601 5,632,745 5,275,943 Energy Consumption MBTU/year 25,441 -78,124 24,104 Air Emissions Total Particulate Matter lbs Total PM/year 2,169 -20,932 2,460 Nitrogen Oxides lbs NOx/year 31,696 -18,168 36,069 Sulfur Oxides lbs SOx/year 4,820 -106,982 10,876 Carbon Monoxide lbs CO/year 70,427 17,658 10,395 Carbon Dioxide Biomass lbs CO2 Bio/year 66,985,027 34,762,135 33,212,574 Carbon Dioxide Fossil lbs CO2 Fossil/year 947,314 -18,162,155 2,072,962 Green House Equivalents tons GHE/year 1,807 -2,590 379 Hydrocarbons(non CH4) lbs HC/year 5,299 3,649 5,930 Lead (Air) lbs Pb (Air)/year 0 0 0 Ammonia(Air) lbs NH4 (Air)/year 0 -2 301 Methane(CH4) lbs CH4/year 585,843 -39,723 33,616 Hydrochloric Acid lbs HCl/year 887 4,062 146 Total Solid Waste lbs SWTotal/year 125,231 -3,723,605 250,242 Waterborne Pollutants Dissolved Solids lbs DS/year 3,730 1,734 10,592 Suspended Solids lbs SS/year 204 -13,587 4,232 BOD lbs BOD/year 19,261 59 3,143 COD lbs COD/year 53,637 242 24,107 Oil lbs Oil/year 3,296 154 260 Sulfuric Acid lbs H2SO4/year 2 -195 13 Iron lbs Fe/year 11 -1,056 166 Ammonia (Water) lbs NH4 (Water)/year 615 5 731 Copper lbs Cu/year 0 0 1 Cadmium lbs Cd/year 0 0 2 Arsenic lbs As/year 0 0 0 Mercury (Water) lbs Hg (Water)/year 0 0 0 Phosphate lbs P/year 5 -98 264 Selenium lbs Se/year 0 0 0 Chromium lbs Cr/year 0 0 0 Lead (Water) lbs Pb (Water)/year 0 0 3 2 Zinc lbs Zn/year 0 0 Parameter Units Landfill MWC Compost
Annual Dollar Cost 6,000,000 5,000,000 4,000,000 3,000,000 2,000,000 1,000,000 0 Landfill MWC Compost
Annual Energy Use (MBTU) 40,000 20,000 0 -20,000 -40,000 -60,000 -80,000 Landfill MWC Compost
Annual Tons Carbon Equivalents 2,000 1,500 1,000 500 0 -500 -1,000 -1,500 -2,000 -2,500 -3,000 Landfill MWC Compost
Department of Ecology, Washington State) • Goals • Develop an environmental profile of residential curbside recycling for four regions (two urban, two rural) • Compare recycling to land disposal and MWC (when available in the regions). • Washington State Urban Regions Mass Flow (tons/year) Urban West Urban East Waste Management Activity Recycling Landfill Recycling MWC Collection (residential mixed waste) 210,000 16,600 Collection (residential commingled recyclables) 210,000 16,600 Commingled MRF 210,000 16,600 WTE Combustion 16,600 Landfill 210,000 42 Ash Landfill 1,135
Urban West Urban East Parameter Units Recycling Landfill Recycling MWC Cost $/year 44,341,963 50,026,036 10,954,152 12,430,411 Energy Consumption MBTU/year -2,749,080 288,149 -293,155 -131,938 Air Emissions Total Particulate Matter lbs Total PM/year -17,862 15,810 -16,757 -19,908 Nitrogen Oxides lbs NOx/year -660,638 331,865 -67,239 21,238 Sulfur Oxides lbs SOx/year -1,924,036 43,661 -250,564 -131,208 Carbon Monoxide lbs CO/year -1,306,292 471,473 -198,390 10,800 Carbon Dioxide Biomass lbs CO2 Bio/year 300,968,506 424,900,480 41,212,459 35,920,137 Carbon Dioxide Fossil lbs CO2 Fossil/year -194,652,322 9,597,341 -22,208,012 -15,838,770 Green House Equivalents tons GHE/year -27,921 11,954 -3,185 -2,204 Hydrocarbons (non CH4) lbs HC/year -500,690 47,601 -53,461 -12,704 Lead (Air) lbs Pb (Air)/year -53 0 -9 0 Ammonia (Air) lbs NH4 (Air)/year -2,680 5 -531 -79 Methane (CH4) lbs CH4/year -481,006 3,717,419 -54,528 -15,258 Hydrochloric Acid lbs HCl/year -13,065 5,598 -1,661 4,231 Total Solid Waste lbs SWTotal/year -31,989,139 776,033 -4,115,331 -3,329,292 Waterborne Pollutants Dissolved Solids lbs DS/year -1,181,551 44,012 -140,828 -71,714 Suspended Solids lbs SS/year 310,653 1,441 34,217 -12,383 BOD lbs BOD/year 404,928 122,252 52,156 866 COD lbs COD/year 658,847 340,765 36,136 1,812 Oil lbs Oil/year -16,357 40,844 -1,428 -562 Sulfuric Acid lbs H2SO4/year -1,313 13 -165 -156 Iron lbs Fe/year 243 51 527 -848 Ammonia (Water) lbs NH4 (Water)/year -1,357 3,912 -203 -11 Copper lbs Cu/year 0 0 0 0 Cadiumm lbs Cd/year -60 2 -7 -3 Arsenic lbs As/year 0 0 0 0 Mercury (Water) lbs Hg (Water)/year 0 0 0 0 Phosphate lbs P/year -473 32 -59 -76 Selenium lbs Se/year 0 0 0 0 Chromium lbs Cr/year -61 2 -7 -3 Lead (Water) lbs Pb (Water)/year 0 0 0 0 Zinc lbs Zn/year 35 1 11 -1
Urban West Region - Annual Cost 51,000,000 50,000,000 49,000,000 48,000,000 47,000,000 46,000,000 45,000,000 44,000,000 43,000,000 42,000,000 41,000,000 UW - Recycling UW - Landfill
Urban West Region – Annual Energy Use (MBTU) 500,000 0 -500,000 -1,000,000 -1,500,000 -2,000,000 -2,500,000 -3,000,000 UW - Recycling UW - Landfill
Urban West Region – Annual Pounds SOx Emissions 200,000 0 -200,000 -400,000 -600,000 -800,000 -1,000,000 -1,200,000 -1,400,000 -1,600,000 -1,800,000 -2,000,000 UW - Recycling UW - Landfill
Urban East Region - Annual Cost 12,500,000 12,000,000 11,500,000 11,000,000 10,500,000 10,000,000 UE - Recycling UE - MWC
Urban East Region – Annual Energy Use (MBTU) 0 -50,000 -100,000 -150,000 -200,000 -250,000 -300,000 UE - Recycling UE - MWC
Urban East Region – Annual Pounds SOx Emissions 0 -50,000 -100,000 -150,000 -200,000 -250,000 -300,000 UE - Recycling UE - MWC
EPA’s New Facility in RTP, NC • Goals • Develop an environmental profile of yard and food waste composting for EPA’s new facility in RTP, NC. • Composting onsite at the EPA facility • Composting offsite at a regional facility • Compare composting to land disposal. • Mass Flow (tons/year) Scenario Waste Management Activity Landfill Compost - Onsite Compost - Offsite Collection 175 175 175 Compost 175 100 Landfill 175 75
Scenario Parameter Units Landfill Compost - Onsite Compost - Offsite Cost $/year 8,525 11,239 28,636 Energy Consumption MBTU/year 81 57 209 Air Emissions Total Particulate Matter lbs Total PM/year 12 9 14 Nitrogen Oxides lbs NOx/year 100 68 433 Sulfur Oxides lbs SOx/year 18 39 64 Carbon Monoxide lbs CO/year 447 39 98 Carbon Dioxide Biomass lbs CO2 Bio/year 443,320 170,558 170,569 Carbon Dioxide Fossil lbs CO2 Fossil/year 2,907 6,427 14,648 Green House Equivalents tons GHE/year 11 1 3 Hydrocarbons (non CH4) lbs HC/year 11 8 62 Lead (Air) lbs Pb (Air)/year 0 0 0 Ammonia (Air) lbs NH4 (Air)/year 0 2 2 Methane (CH4) lbs CH4/year 3,875 210 214 Hydrochloric Acid lbs HCl/year 6 1 1 Total Solid Waste lbs SWTotal/year 699 945 1,075 Waterborne Pollutants Dissolved Solids lbs DS/year 9 28 61 Suspended Solids lbs SS/year 1 13 14 BOD lbs BOD/year 127 13 13 COD lbs COD/year 355 80 81 Oil lbs Oil/year 16 1 2 Sulfuric Acid lbs H2SO4/year 0 0 0 Iron lbs Fe/year 0 1 1 Ammonia (Water) lbs NH4 (Water)/year 4 2 2 Copper lbs Cu/year 0 0 0 Cadmium lbs Cd/year 0 0 0 Arsenic lbs As/year 0 0 0 Mercury (Water) lbs Hg (Water)/year 0 0 0 Phosphate lbs P/year 0 1 1 Selenium lbs Se/year 0 0 0 Chromium lbs Cr/year 0 0 0 Lead (Water) lbs Pb (Water)/year 0 0 0 Zinc lbs Zn/year 0 0 0
Annual Dollar Cost 30,000 25,000 20,000 15,000 10,000 5,000 0 Landfill Compost - Onsite Compost - Offsite
Annual Energy Use (MBTU) 250 200 150 100 50 0 Landfill Compost - Onsite Compost - Offsite
Particulate Matter (lbs/yr) 14 12 10 8 6 4 2 0 Landfill Compost - Onsite Compost - Offsite
Carbon Equivalents (tons/yr) 12 10 8 6 4 2 0 Landfill Compost - Onsite Compost - Offsite
Public Release of Final Outputs • MSW-DST is available! • currently through RTI. • Weighing options for developing a more easily accessible internet-based version. • Expect to release LCI Database this summer (once cleared by EPA review).
Next Steps • Completing last stages of: • addressing peer review comments • beta testing and QA/QC • review/verification of defaults • review of supporting documentation and User’s Manuals • Finalizing partnerships in the release of the MSW-DST and database • Ensuring the final products are maintained over time • Evaluating options for addressing comments such as • Developing web based platform • Ensuring maintenance of database and software • Providing technical support and training
www.rti.org/units/ese/p2/lca.cfm Please visit the project Internet site at:
Contacts:Keith WeitzResearch Triangle Institutekaw@rti.orgor (919) 541-6973Susan ThorneloeU.S. Environmental Protection Agency Thorneloe.Susan@epa.govor (919) 541-2709