Download
1 / 35
360 likes | 428 Views
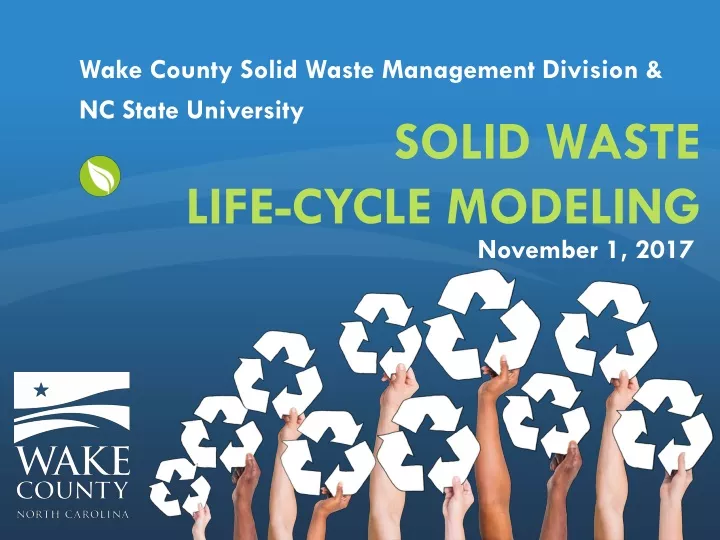
Wake County Solid Waste Management Division & NC State University. Solid Waste Life-Cycle Modeling. November 1, 2017. Statement of Purpose.

E N D
Wake County Solid Waste Management Division & NC State University Solid Waste Life-Cycle Modeling November 1, 2017
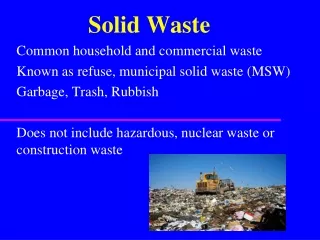
Statement of Purpose The Solid Waste Division of Environmental Services protects the public health and safety of Wake County citizens by providing quality solid waste and recycling services that are efficient, cost effective and environmentally responsible. Landfill Gas Blower Landfill Partial Closure New Convenience Center Under Construction
Scope of Solid Waste Services Reduce Waste • Increase recycling & reduce litter thru education & outreach • Provide disposal location via SWLF and EWTS • Minimize illegal dumping thru enforcement & providing convenience centers for residential use • Collect banned items from landfills at MMRFs for business & residential use • Protect the environment by providing HHW facilities for residential use and monitoring and maintaining closed landfills
Ongoing & Upcoming Issues Population Growth Over 1 million residents More People=More Waste Landfill Life Potentially Shortened
Growth & Sustainability • Current Board of Commissioners established Board goals during 2016 • GS2.3 - Extend the life of the South Wake Landfilland development of SW Comprehensive Plan • Better Recycling • Use Technology & Innovation, including modeling of future waste scenarios and options • Life of landfill (LOL…) study underway via SCS with coordination efforts with NCSU modeling • SW Action Plan reflects ongoing & upcoming efforts
Life-Cycle Modeling Decision • Wake County, via our SWLF Partnership, provides MSW disposal services for munis & commercial waste haulers • Though many years of capacity remain for the SWLF (2040+), due to timing to consider new landfill or other waste disposal options, determined a need to start investigating now • Prior studies (1995, 2003) looked at specific technology • Decision to develop model that could be used to evaluate all aspects (cost, resource/energy consumption and environmental performance) that can be continuously updated to reflect changing assumptions
NCSU Partnership • Established contract with NCSU Civil Engineering Department to expand development of SWOLF specifically for Wake County use • Work started in 2015 with extensive data collection • DEQ Annual Reports • County Solid Waste Management Plan • Meetings with munis and county staff
Problem Statement Evaluate strategies to cost-effectively improve the sustainability of Wake County’s municipal solid waste management while considering • changing population, waste generation and composition, • landfill life, • energy and material recovery, and • environmental emissions and impacts
Research Approach • Use a tool developed at NC State • Solid Waste Optimization Lifecycle Framework (SWOLF) • SWOLF estimates the full system costs and emissions associated with waste management processes • collection through final disposal • considers benefits from recycling and energy recovery • Modeled Wake County’s solid waste system based on available data and reports • waste generation and composition • existing and potentialfuture waste management facilities
SWOLF – Solid Waste Optimization Lifecycle Framework Evaluate system performance (i.e., economical, environmental) while accounting for changes to waste composition and generation, SWM policy, the U.S. energy system, and potential future GHG mitigation policies LCA Model Impact Assessment Model (e.g., Global Warming, Smog Formation) GHG Policy SWM Process Models Optimizable Integrated SWM System Model • Cost • Emissions • Energy Use • Impacts Energy System SWM Policy Waste Generation and Composition
Benefits of Optimization Modeling (1/2) • How can net present cost be minimized over time? • While meeting diversion or greenhouse gas constraints • Considering existing infrastructure • How can environmental benefits be maximized? • Minimize greenhouse gas emissions • Minimize fossil energy use • Maximize landfill diversion • Impose a budget constraints
Benefits of Optimization Modeling (2/2) • What are the mitigation costs ($/MTCO2E avoided) or trade-offs associated with adopting a specific technology or policy? • WTE combustion, composting, AD, etc. • Landfill organics bans, diversion targets, combustion • How do changes to the energy system affect these decisions? • Can our system robustly adapt to changes to the energy system, policy, waste composition, and waste generation?
Representing Wake County in SWOLF • Existing facility options • Composting facilities (COMP) • Landfill (LF) • Single-stream material recovery facility (SSMRF) • Transfer station (TS) • Residential waste • 10 single family sectors • 2 multi-family sectors • Convenience (drop off) Centers • Collection or drop-off • Recyclables • Organics (yard, food waste) • Residual waste • Future facility options • Anaerobic digestion (AD) • Thermal waste-to-energy (WTE) • Mixed waste material recovery facility (MWMRF) Private waste collection • Commercial • waste • Sector specific
Representing Wake County in SWOLF Existing Facilities Waste generation and composition Potential Facilities
Scenarios • Developed several scenarios to explore how new processes could be added to the existing solid waste system.
Adding food waste collection to current system • Adding food waste to yard waste collection has a small impact on the average cost of collection ($/Mg) +FWAD Min GHG Base +FW +FWAD
Adding food waste collection to current system • Adding food waste to yard waste collection has a small impact on the average cost of collection ($/Mg) Same; AD not used if minimizing cost +FWAD Min GHG Base +FW +FWAD
Adding food waste collection to current system • Adding food waste to yard waste collection has a small impact on the average cost of collection ($/Mg) GHGs Decrease; AD Utilization +FWAD Min GHG Base +FW +FWAD
Adding food waste collection to current system • Adding food waste to yard waste collection has a small impact on the average cost of collection ($/Mg) Cost Increases +FWAD Min GHG Base +FW +FWAD
Cases 1-3: Base case and adding food waste collection to current system • Adding food waste to yard waste collection has a small impact on the average cost of collection ($/Mg) • GHG Mitigation cost for adding food waste collection is 550 $/MTCO2e • Minimizing GHG with food waste collection and AD increases cost by $3.1M with a mitigation cost of $920 MTCO2e +FWAD Min GHG Base +FW +FWAD
Case 4: + Mixed Waste MRF (+MWMRF) • Current system + food waste collection with AD enabled (optional) + mixed waste MRF • Separate collection of recyclables and yard/food waste required (3 separate collections) • Set increasing diversion targets • Lowest target = diversion in min-cost solution • Highest target = diversion in max-diversion solution
Case 4: + Mixed Waste MRF (+MWMRF) Mixed waste MRF use starts with sectors closet to MRF; furthest from LF Base Percent Diverted
Case 4: + Mixed Waste MRF (+MWMRF) Diversion, MWMRF Use, and Cost Increase GHG Emissions Decrease Mitigation cost: 50 to 90 $/MTCO2e Base Percent Diverted
Case 5: + WTE Combustion (+WTE) • Current system + food waste collection with AD enable (optional) + WTE • Separate collection required • Set increasing diversion targets • Lowest target = diversion in min-cost solution • Highest target = diversion in max-diversion solution
Case 5: + WTE Combustion (+WTE) WTE (located at LF) starts with selected sectors based on composition Base Percent Diverted
Case 5: + WTE Combustion (+WTE) Diversion, WTE Use, and Cost Increase GHG Emissions Decrease Mitigation cost: 160 to 180 $/MTCO2e Base Percent Diverted
Case 6: + MWMRF + WTE (ALL) • Current system + food waste collection with AD enabled (optional) + mixed waste MRF + WTE • Separate collection of recyclables and yard/food waste required (3 separate collections) • Set increasing diversion targets • Lowest target = diversion in min-cost solution • Highest target = diversion in max-diversion solution
Case 6: +MWMRF + WTE (ALL) MWMRF is only used to meet maximum diversion Base Percent Diverted
Case 6: +MWMRF + WTE (ALL) Increasing WTE Use Base Percent Diverted
Case 6: +MWMRF + WTE (ALL) Mitigation cost is 120 to 180 $/MTCO2e Base Percent Diverted
Observations and Summary • SWOLF is effective at quantifying the cost and environmental impacts of new technology implementation and associated tradeoffs between cost, diversion and GHGs • Continuous engagement with the county was very important in the development of useful results • The county does not control municipal collection or commercial waste • Dialog with municipalities is essential for long-term facility commitments • Impact of commercial waste on facility sizing and life is required
Observations and Summary • Collecting residential food waste with yard waste is predicted to decrease landfill greenhouse gas (GHG) emissions by 12%, but has a modest effect on diversion rate and landfill life. • Increasing residential recycling participation will decrease GHG emissions and increase landfill diversion. • Extension of landfill life is limited by • Current waste composition (what can be diverted) • Participation in recycling efforts • Increasing diversion does not necessarily decrease GHG emissions • Max diversion with Waste-to-Energy combustion is 81% • Min GHG emissions occur with 77% diversion
Next Steps • Complete Life-Cycle Study/report • Coordinate with Life of Landfill study • Update on a regular basis to reflect system changes and monitor impacts – changes such as: • Energy pricing • System hauling/pick up changes • Waste generation and composition
Questions? John Roberson Wake County Solid Waste Director john.roberson@wakegov.com Morton Barlaz North Carolina State University barlaz@ncsu.edu