Download
1 / 27
270 likes | 405 Views
Understanding RPC Efficiencies And The Cross-talks . Arunava Mukherjee Supervisor: Prof. N. K. Mondal. Motivation .

E N D
Understanding RPC Efficiencies And The Cross-talks Arunava Mukherjee Supervisor: Prof. N. K. Mondal
Motivation • Are widely utilized or projected to be in many high energy and astro-particles physics experiments. The RPC array is a key element when it comes to the traditional function of Muon detection. • RPCs find use as the active elements in the tracking (iron) calorimeter which can simultaneously measure the energy as well as the direction of the charged particle • The iron calorimeter contains iron plates as the absorber of energy and glass RPCs or Scintillators as the active detector device. The detector working concepts are based on the detection of gaseous ionization produced by charged particles traversing the active area of the detector, under a strong uniform electric field applied by resistive electrodes
Why RPC ? • They have a good position resolution and give good detection efficiency. • They can easily cover substantial amount of area but simultaneously with minimal cost. • The cost of the RPC is much smaller as compared to scintillators. • These are easy to assemble and they require simple read-out electronics. • They exhibit better time resolution than scintillators.
Basic Principle of Gaseous Ionization Detectors • Consists at least one gas chamber whose two opposite faces must be made of conducting materials. In these two surfaces we apply high voltages (~ 10 KVolt.) is applied. • The chamber is filled with gasses (about which I’ll write later). • When sufficiently energetic radiation penetrates the chamber it ionizes the gas molecules and as a result it produces certain numbers of “electron-ion pairs”. Mean number of pairs created is proportional to the energy deposited on the chamber. • With the application of the strong electric field, the electrons are drawn towards the anode and ions towards the cathode where they are collected.
Basic Principle of Gaseous Ionization Detectors (Continued) • If the electric field is strong enough, the freed electrons are accelerated to enough high energies where they are also capable of ionising gas molecules in the chamber. The electrons liberated in this secondary ionization then accelerate to produce still more ionizations and so on. This results in an ionization avalanche or cascade. • When such avalanches increase in number they form a streamline of continuous flow of charges from one electrode to the other. This forms a streamer pulse. • This forms a streamer pulse. The pulses are collected by appropriate front-end electronics.
Resistive Plate Chamber (RPC) • An RPC is a particle detector that utilizes a constant and uniform electric field produced by two parallel electrode plates which is made of a material of high bulk resistivity. Owing to the high resistivity of the electrodes, the electric charge quickly dies off in a very limited area (typically 0.1cm2) around the points where the discharge occurs. The discharge produces signals which are counted and analysed by appropriate read out electronics.
Structure of a standard single layer RPC • Resistive electrode plates made of commercial float glass with a volume resistivity of the order of 1012 Ohms and thickness of 3mm. they are put on top, parallel to each other within the framework
Principle of operation of RPC Resistive plate Resistive plate Resistive plate Charge depletion induces signal. Charge depletion fixed by geometry, resistivity, gas. Dielectric Region recharges on scale of up to sec due to bulk resistivity (1011Wcm) Streamer forms, depletes charge over (1-10mm2). Field drop quenches streamer ++++++++++++++++ +++++ + + +++++ +++++ +++++ Ionization leads to avalanche HV HV HV ----- ----- Gas ----- - - ----
Gas System • The choice of filling gas for RPCs is governed by several factors: low working voltage, high gain, good proportionality and high rate capability. For a minimum working voltage, noble gases are usually chosen since they require the lowest electric field intensities for avalanche formation. • Therefore the role taken by the gas mixture is essential. The first ionization potential, the first Townsend co-efficient and the electronegative attachment co-efficient determine the avalanche multiplication, the presence and relative importance of photo production, the saturated avalanche range to the streamer mode. The gas mixture fixes the working mode of the RPC in ‘avalanche’ or in ‘streamer’ mode, resulting in different characteristics and performances.
Gas System (continued) • The filling gas is usually composed by an optimized mixture. To work in ‘streamer’ mode the main component should provide a robust first ionization signal and a large avalanche multiplication for a low applied field. One typical element can be Argon, because of its higher specific ionization and lower cost is usually preferred, which ensures great avalanche increase with electron abundance, good situation to start streamer production. • To work in ‘avalanche’mode the main component could be an electronegative gas, with high enough primary ionization production but with small free path for electron capture. The high electronegative attachment coefficient limits the avalanche electrons number. Tetrafluorehtane (known as Freon), which is widely used, has shown these specifics. But here we use R134A (as Freon) which is eco-friendly.
Gas System (continued) • One more component is constituted by polyatomic gases, often hydrocarbons, which have a high absorption probability for ultra violate photons, produced in electron-ion recombination. This gas is known as ‘quenching gas’. This component allows to the energy by vibrational and rotational energy levels, avoiding photo-ionization with related multiplication and limiting the lateral charge spread. In our gas mixture we have used Iso-Butane as the ‘quenching gas’. • Finally we use SF6 (Sulfur-hexafluoride) to control the excess number of electrons. A small quantity of SF6, in a few per mill fraction of the standard gas mixture could enlarge the pure avalanche mode operating voltage range up to 1 kV streamer free plateau.
Calibration of The MFC in the Gas System • The gas system must be strictly reliable in controlling relative components under studies. It is composed of several Mass Flow Meters calibrated for specific gases and one controller station. The gas volume of the RPC gap under test (~ 10-100 ml) and the chosen number of volume refill per minute fix the total flux flowing through the system, typically 30 SCCM. • In these tests the secondary or tertiary gaseous compounds in the mixture can vary from tenths of percents (e.g. Iso-Butane) to a few per mill fraction (e.g. SF6) of total gas flux, i.e. ~ 30 SCCM. These small fluxes and variety of utilized gases fix sometimes the working condition of Mass Flow Meters. Linearity and stability of sharp drops of differential pressure between in and out are guaranteed for these instruments.
Calibration of The MFC in the Gas System (continued) • The gas is fluxed into the graduated tube filled with water and turned upside down in a vessel full of water as well. The gas starts to bubble at the time t0 at the water-air separation surface. By a stop watch we measure the time ti and during which the volume Vi it has occupied by measuring the decrease in the water level in the tube. Therefore, the flux is measured as • Flux = (Change in Volume)/( ti - t0)
Calculating The Gas Flow Rates As per the reading displayed in the gas system Freon 28.5 SCCM Iso-butane 1.08 SCCM SF6 0.02 SCCM Argon 0.00 (NIL) After correcting the value from the calibration curve Freon 25.77 SCCM Iso-butane 1.206 SCCM SF6 0.054 SCCM Argon 0.00 (NIL) Therefore, total amount of gas flow rate (Freon + Iso-butane + SF6) = (25.77 + 1.206 + 0.054) SCCM = 27.03 SCCM = 27.03 c.c./min. Hence, each RPC chamber gets an average of (27.03 ÷ 9) SCCM = 3.0033 SCCM = 3.0033 c.c./min. Now, the volume of 1-RPC gas-chamber is 1m × 1m × 2mm = 100 × 100 × 0.2 c.c. = 2000 c.c. Therefore, the time required to fill the gas chamber by these desired gas-mixture is = (2000 ÷ 3.0033) min. = 665.9 min. = 666 min. (approx.) = 11.1 hr. Consequently, in a single day (24 hr.) 24/11.1 = 2.16 “effective” volume of gas will be flown through the RPC chambers.
Before After ++++++ ++++++ ++++++++++++++++++++ --------- ------- ------------------------- Signal Induction and Readout • The charge signal drifting in the gas gap generates a current induced on the electrically isolated metallic pick up strips. The electron and ion currents are absorbed through resistive electrodes by high power supply. • The main advantage for their high resistivity, the drop in the applied tension during the discharge in the gas is specially localized. The dead time for the detector is due to the time necessary to restore the voltage tension at the gas gap, but will concern only on a small area of the detector surface. The discharged area recharges slowly through the high-resistivity glass plates
r ke æ ö æ ö l A t = @ = rke 0 ç ÷ ç ÷ RC 0 A l è ø è ø t = 5 = 10 -12 ( x 10 ) x 4 x (8.85 x 10 ) 2 s 2 0 . 1 cm 2 500 Hz/m RPC rate capability Each discharge locally deadens the RPC. The recovery time is approximately +++++++ +++++++ ------------ -------- Numerically this is (MKS units) Assuming each discharge deadens an area of , rates of up to can be handled with 1% deadtime or less. This is well below what is expected in our application.
Typical signal output as seen by CRO A typical signal in the avalanche mode The RPC missed to detect the muon A typical signal in the streamer mode A typical unwanted signal
RPC Efficiency The schematic diagram of the big-stack RPC system
RPC Efficiency (continued) To measure the efficiency of the RPC we set up our experiment in such a way as to ensure that the trigger pulse generated is solely due toatmospheric muons. To do that we have to exclude all other cosmic rays whish form a background noise. We set up a coincidence circuit for our present purpose. For these we use five scintillators as five paddles. Thus we make a cosmic ray telescope with these scintillators. We named them P1-P5. We put our RPC as shown in the diagram above. We keep three 3 cm. paddles (P1-P3) along the main strip and two 20 cm wide Veto paddles (P4-P5) across the middle paddle P2. the two big paddle P4 and P5 can move horizontally in lateral direction. These two govern the opening of the telescope window and hence are known as Veto. For this set up the probability of the chance coincidence is P!.P2.P3.P4*.P5* . This ensures that muon trigger is generated when we have three of the paddles (P1, P2, P3) are in coincidence and (P3, P4) in anti-coincidence.
RPC Efficiency (Plot) Now, Efficiency of RPC = (3-fold × Veto × RPC)/ (3-fold × Veto) i.e., (# of pulses in the RPC output above some threshold value 20mV.)/(# of muon trigger).
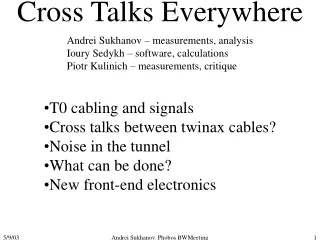
And the Cross-talks Here the Cross-talk is defined by (3-fold × Veto × adjacent RPC)/ (3-fold × Veto)
And Finally The Time-constant Gaussian-fit of the TDC-Count
Acknowledgement I would like to take the opportunity to acknowledge the invaluable and indispensable guidance of Prof. N. K. Mondal, without which this project would not have materialized. I would like to thank S.D. Kalmani and A. Joshi for guiding me through the actual hardware for building RPCs. I appreciate the help extended to me by M. R. Bhuyan and B. Satyanarayana. I also thank to Ravindra R. Shinde, L. V. Reddy, Shekhar Lahamge and P. Verma for their their kind co-operation.
References • (1) UNIVERSITÀ DEGLI STUDI DI ROMA “TOR VERGATA” RPCs as Atlas Trigger detectors at LHC – by Barbara Liberti • (2) Techniques for nuclear and particle physics experiments, William R. Leo, 2nd Rev. Ed. Narosa Publishing House. • (3) India-based Neutrino Observatory (INO), Apower point presentation by N. K. Mondal, TIFR. • (4) Pramana – journal of physics,Vol.69, No. 6 Dec 2007 -- Preliminary Results from India-based Neutrino Observatory detector R&D Programme by Sarika et al. • (5) Yu N. Pestov, G.V. Fedotovich, Preprint IYAP-77-78, Slac Translation, 184 (1978); G.Battistoni et al. Nucl. Instr. Meth. 152, 423 (1978); G. Battistoni et al., Nucl. Instr. and Meth. 176, 297 (1980). • (6) R. Santonico, R. Cardarelli, Nucl. Instr. and Meth. 187 (1981) 377. • (7) INO Project Report, INO/2006/01.