Download
1 / 1
30 likes | 280 Views
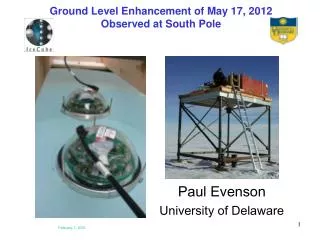
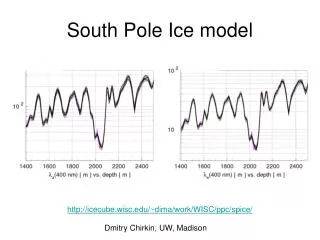
SH21A-2183. Ground Level Enhancement of May 17, 2012 Observed at South Pole. Takao Kuwabara 1,3 ; John Bieber 1 ; John Clem 1,3 ; Paul Evenson 1,3 ; Tom Gaisser 1,3 ; Roger Pyle 2 ; Serap Tilav 1,3

E N D
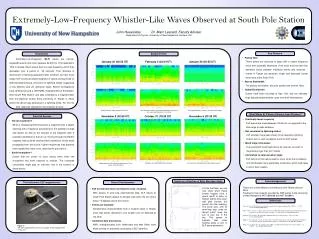
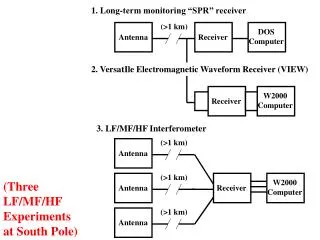
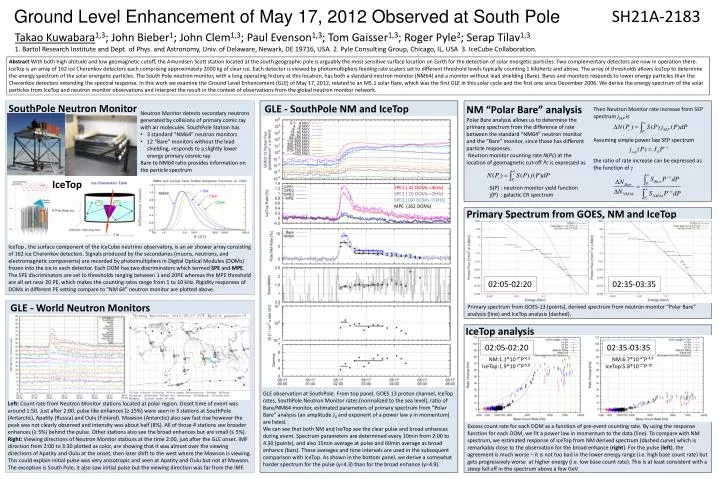
SH21A-2183 Ground Level Enhancement of May 17, 2012 Observed at South Pole Takao Kuwabara1,3; John Bieber1; John Clem1,3; Paul Evenson1,3; Tom Gaisser1,3; Roger Pyle2; Serap Tilav1,3 1. Bartol Research Institute and Dept. of Phys. and Astronomy, Univ. of Delaware, Newark, DE 19716, USA. 2. Pyle Consulting Group, Chicago, IL, USA 3. IceCube Collaboration. Abstract With both high altitude and low geomagnetic cutoff, the Amundsen Scott station located at the south geographic pole is arguably the most sensitive surface location on Earth for the detection of solar energetic particles. Two complementary detectors are now in operation there. IceTop is an array of 162 ice Cherenkov detectors each comprising approximately 2000 kg of clear ice. Each detector is viewed by photomultipliers feeding rate scalers set to different threshold levels typically counting 1 kilohertz and above. The array of thresholds allows IceTop to determine the energy spectrum of the solar energetic particles. The South Pole neutron monitor, with a long operating history at this location, has both a standard neutron monitor (NM64) and a monitor without lead shielding (Bare). Bares and monitors responds to lower energy particles than the Cherenkov detectors extending the spectral response. In this work we examine the Ground Level Enhancement (GLE) of May 17, 2012, related to an M5.1 solar flare, which was the first GLE in this solar cycle and the first one since December 2006. We derive the energy spectrum of the solar particles from IceTop and neutron monitor observations and interpret the result in the context of observations from the global neutron monitor network. SouthPole Neutron Monitor GLE - SouthPole NM and IceTop NM “Polar Bare” analysis Polar Bare analysis allows us to determine the primary spectrum from the difference of rate between the standard “NM64” neutron monitor and the “Bare” monitor, since those has different particle responses. Neutron monitor counting rate N(Pc) at the location of geomagnetic cut-off Pc is expressed as Then Neutron Monitor rate increase from SEP spectrum jSEP is • Neutron Monitor detects secondary neutrons generated by collisions of primary comic ray with air molecules.SouthPole Station has • 3 standard “NM64” neutron monitors • 12 “Bare” monitors without the lead shielding, responds to a slightly lower energy primary cosmic ray • Bare to NM64 ratio provides information on the particle spectrum Assuming simple power law SEP spectrum the ratio of rate increase can be expressed as the function of IceTop SPE1 ( 42 DOMs >4kHz) SPE2 ( 20 DOMs >2kHz) SPE3 (100 DOMs <2kHz) MPE (162 DOMs) S(P) : neutron monitor yield function j(P) : galactic CR spectrum Primary Spectrum from GOES, NM and IceTop IceTop, the surface component of the IceCube neutrino observatory, is an air shower array consisting of 162 ice Cherenkov detectors. Signals produced by the secondaries(muons, neutrons, and electromagnetic components) are recorded by photomultipliers in Digital Optical Modules (DOMs) frozen into the ice in each detector.Each DOM has two discriminators which termed SPE and MPE. The SPE discriminators are set to thresholds ranging between 1 and 20PE whereas the MPE threshold are all set near 20 PE, which makes the counting rates range from 1 to 10 kHz. Rigidity responses of DOMs in different PE setting compare to “NM 64” neutron monitor are plotted above. 02:05-02:20 02:35-03:35 GLE - World Neutron Monitors Primary spectrum from GOES-13 (points), derived spectrum from neutron monitor “Polar Bare” analysis (line) and IceTop analysis (dashed). IceTop analysis 02:05-02:20 02:35-03:35 NM:1.1*10-3*P-4.3 IceTop:1.9*10-2*P-9.8 NM:6.7*10-4*P-4.9 IceTop:5.8*10-2*P-10. GLE observation at SouthPole. From top panel, GOES 13 proton channel, IceTop rates, SouthPole Neutron Monitor rates (normalized to the sea level), ratio of Bare/NM64 monitor, estimated parameters of primary spectrum from “Polar Bare” analysis (an amplitude J0and exponent of a power law γin momentum) are listed. We can see that both NM and IceTop see the clear pulse and broad enhances during event. Spectrum parameters are determined every 10min from 2:00 to 4:30 (points), and also 15min average at pulse and 60min average as broad enhance (bars). These averages and time intervals are used in the subsequent comparison with IceTop.As shown in the bottom panel, we derive a somewhat harder spectrum for the pulse (γ=4.3) than for the broad enhance (γ=4.9). Left: Count rate from Neutron Monitor stations located at polar region. Onset time of event was around 1:50. Just after 2:00, pulse like enhances (≥ 15%) were seen in 3 stations at SouthPole (Antarctic), Apatity (Russia) and Oulu (Finland).Mawson (Antarctic) also saw fast rise however the peak was not clearly observed and intensity was about half (8%). All of those 4 stations see broader enhances (≥ 5%) behind the pulse. Other stations also see the broad enhances but are small (≤ 5%). Right: Viewing directions of Neutron Monitor stations at the time 2:00, just after the GLE onset. IMF direction from 2:00 to 3:30 plotted as color, are showing that it was almost over the viewing directions of Apatity and Oulu at the onset, then later shift to the west where the Mawson is viewing. This could explain initial pulse was very anisotropic and seen at Apatity and Oulu but not at Mawson. The exception is South Pole, it also saw initial pulse but the viewing direction was far from the IMF. Excess count rate for each DOM as a function of pre-event counting rate. By using the response function for each DOM, we fit a power law in momentum to the data (line). To compare with NM spectrum, we estimated response of IceTop from NM derived spectrum (dashed curve) which is remarkably close to the observation for the broad enhance (right). For the pulse (left), the agreement is much worse – it is not too bad in the lower energy range (i.e. high base count rate) but gets progressively worse at higher energy (i.e. low base count rate). This is at least consistent with a steep fall off in the spectrum above a few GeV.