Download
1 / 50
500 likes | 1.16k Views
Periodic Table. Kelter, Carr, Scott, Chemistry A World of Choices 1999, page 74. History of the Periodic Table. Dmitri Mendeleev. Russian - 1872 Invented periodic table Organized elements by properties Arranged elements by atomic mass Predicted existence of several unknown elements

E N D
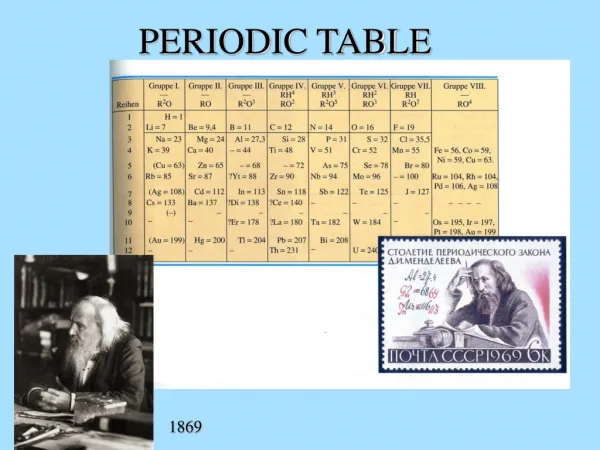
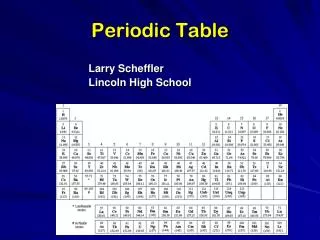
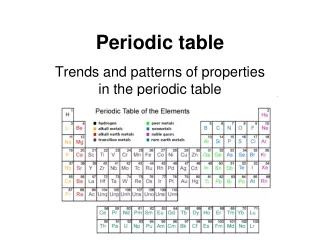
Periodic Table Kelter, Carr, Scott, Chemistry A World of Choices 1999, page 74
Dmitri Mendeleev • Russian - 1872 • Invented periodic table • Organized elements by properties • Arranged elements by atomic mass • Predicted existence of several unknown elements • Element 101 Dmitri Mendeleev
Dmitri Mendeleyev (1834-1907) • observed that elements listed in order of atomic mass showed regularly (or periodically) repeating properties. • He announced his Periodic Law in 1869 and published a list of known elements in a tabular form. • He had the courage to leave gaps where the Periodic Law did not seen to fit, predicting that new elements would be discovered to fill them.
Modern Periodic Table • H.G.J. Moseley • Arranged elements by increasing atomic number • Killed in WW I at age 28 (Battle of Gallipoli) 1887 - 1915
Periodic Law • “When elements are arranged in order of increasing atomic number, their physical and chemical properties show a PERIODIC pattern”
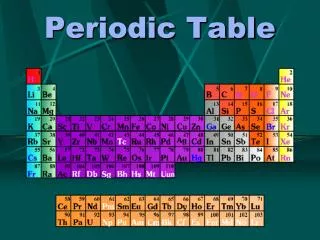
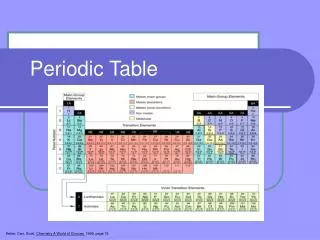
Organization of the Table • Elements that have similar properties are aligned in vertical columns called GROUPS or FAMILIES. • Elements of increasing atomic numbers are arranged in horizontal rows called PERIODS.
Groups • All elements in a group have the same number of valence electrons (outermost) • All elements in a group have similar chemical properties • Increase in the metallic properties from top to bottom
Group 1 – Alkali Metals Metallic Properties Tarnish rapidly Easily forms +1 ions Soft enough to cut with a knife EXTREMELY reactive (air) Valence configuration of s1 Group 2 - Alkaline Earth Metallic properties Form +2 ions Higher densities and melting points of group 1 Valence configuration of s2
Potassium Metal in Water Newmark, CHEMISTRY, 1993, page 25
Group 17 (VIIA) Halogens Very Reactive Various Ions but usually -1 Valence configuration is s2p5 Group 18 (VIIIA) Noble Gases Very UNreactive Called the inert, rare gases, monatomic gases Valence configuration is s2p6
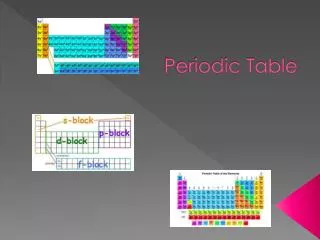
Transition Elements • D-block elements • Have several empty or half filled d orbitals • Multiple oxidation states because the d orbital values are close to those of s orbital values and different electrons can be removed • Form colored solutions • Most have high density and high melting points
Metalloids Metals and Nonmetals H 1 He 2 1 Li 3 Be 4 B 5 C 6 N 7 O 8 F 9 Ne 10 Nonmetals 2 Na 11 Mg 12 Al 13 Si 14 P 15 S 16 Cl 17 Ar 18 3 K 19 Ca 20 Sc 21 Ti 22 V 23 Cr 24 Mn 25 Fe 26 Co 27 Ni 28 Cu 29 Zn 30 Ga 31 Ge 32 As 33 Se 34 Br 35 Kr 36 4 METALS Rb 37 Sr 38 Y 39 Zr 40 Nb 41 Mo 42 Tc 43 Ru 44 Rh 45 Pd 46 Ag 47 Cd 48 In 49 Sn 50 Sb 51 Te 52 I 53 Xe 54 5 Cs 55 Ba 56 Hf 72 Ta 73 W 74 Re 75 Os 76 Ir 77 Pt 78 Au 79 Hg 80 Tl 81 Pb 82 Bi 83 Po 84 At 85 Rn 86 * 6 Fr 87 Ra 88 Rf 104 Db 105 Sg 106 Bh 107 Hs 108 Mt 109 W 7 La 57 Ce 58 Pr 59 Nd 60 Pm 61 Sm 62 Eu 63 Gd 64 Tb 65 Dy 66 Ho 67 Er 68 Tm 69 Yb 70 Lu 71 Ac 89 Th 90 Pa 91 U 92 Np 93 Pu 94 Am 95 Cm 96 Bk 97 Cf 98 Es 99 Fm 100 Md 101 No 102 Lr 103
2/3 of all elements Have luster Good conductors of heat and electricity Solid at room temp. (except Hg) Malleable Ductile Tend to LOSE electrons Poor conductors of heat and electricity (insulators) No luster Not malleable or ductile (brittle) Gaseous, liquid or solid Tend to gain or share electrons. Metals Vs Non-Metals
Semimetals/metalloid • On the stepline • Could have a combination of metal and nonmetal properties • Considered the natural change in character of elements as you go across the period • Only 7 elements
metallic character increases nonmetallic character increases metallic character increases nonmetallic character increases
Solids, Liquids, and Gases • Most elements are solids. • Two liquids on the periodic table: Mercury (Hg) is a metal and Bromine (Br) is a nonmetal. • Ten gases on the periodic table: H2, He, N2, O2, F2, Cl2, Ne, Ar, Kr, Xe, Rn
Diatomic Molecules BrINCLHOF twins H2O2Br2F2I2N2Cl2
Ionization Energy • The energy needed to remove one of an atom’s electrons. • The greater the shielding effect; the easier to remove an electron.
Shielding Effect Valence Kernel electrons block the attractive force of the nucleus from the valence electrons + - - nucleus - Electrons - Electron Shield “kernel” electrons
He Ne Ar Kr H Li Na K Rb First Ionization energy Atomic number
Electronegativity • the ability to attraction electrons in a bond • based on 0-4 scale • Which element has the highest? the lowest? • Fluorine and Francium
Explanation of the trend Electronegativity decreases down a group. • atomic radius increases • outer electrons are shielded from the attraction of the nucleus • bonding electrons are less strongly attracted to nucleus
Explanation of the Trend Electronegativity increases across a period • nuclear charge increases • atomic radius decreases • shielding is negligible because same energy level • bonding electrons more strongly attracted to the nucleus
Atomic Radius • The distance from the center of the atom’s nucleus to the outer edge of the outermost electron.
Periodic Trends in Atomic Radii LeMay Jr, Beall, Robblee, Brower, Chemistry Connections to Our Changing World , 1996, page 175
Atomic Radius - Summary • Across a period, radius decreases because there is a greater pull on the electrons from the nucleus. • Down a period, radius increases because additional energy level is added.
Relative Size of Atoms Zumdahl, Zumdahl, DeCoste, World of Chemistry2002, page 350
Ionic Size • Cations form by losing electrons. • Cations are smaller than the atom they come from. • Metals form cations. • Cations of representative elements have noble gas configuration.
e e Li Li+ Li 152 60 Li+ 152 152 60 Lithium atom Energy e e Li Li + e Lithium ion Lithium atom
Ionic size • Anions form by gaining electrons. • Anions are bigger that the atom they come from. • Nonmetals form anions. • Anions of representative elements have noble gas configuration.
Group 3A e e e e e e e e e Li Li+ 152 Na Na+ Al 50 95 143 186 K K+ 133 227 Trends in Atomic and Ionic Size Metals Nonmetals Group 1A Group 3A F- F 64 60 136 Cl- Cl 99 181 Br- Br 114 195 Cations are smaller than parent atoms Anions are larger than parent atoms
Summary of Periodic Trends Shielding is constant Atomic radius decreases Ionization energy increases Electronegativity increases Nuclear charge increases 1A 0 Nuclear charge increases Shielding increases Atomic radius increases Ionic size increases Ionization energy decreases Electronegativity decreases 2A 3A 4A 6A 7A 5A Ionic size (cations) Ionic size (anions) decreases decreases
How to measure What is the size of the paper? How many decimal places should the answer have?
More Measurement How tall is the plant to the correct number of decimal places?
Metric System k – h – da – base – d – c - m
Accuracy vs. Precision Accuracy – how close the measurement is to a “true value” Precision - how close several measurements are to each other
Significant Figures The A & P rule: Decimal absent : Atlantic Side and count across the country. Decimal present : Pacific Side and count across the country.
How many sig figs present? 37400 300.0 0.0045 Round each to two significant digits. 349987 0.3445 Significant Figures Practice
Significant Figures and Calculations • For + and -; reduce answer to least number of decimal places in the problems • For x and ; reduce answer to least number of significant figures in the problem.
345.1 + 27. 35 99.456 - 34 435.2 x 76.1 150 / 4 Sig Fig Calculation Practice
Density ratio of mass to volume D = m/v on reference table T density is not size dependent. What is the density of a 3 cm cube that weighs 27 g?
Percent Error used to analyze lab data closeness the “true value” observed – accepted x 100 on table T accepted If a student calculates the mass of Ne to be 19.9 g and the true value is 20.2 g; what is the percent error?