Download

1 / 8
0 likes | 11 Views
Our PhD Assistance offers a comprehensive understanding of management-focused regression analysis, enhancing research methodology by guiding through statistical analysis.<br><br>Click here to know more: https://www.phdassistance.com/blog/how-to-interpret-your-regression-output-in-management-phd-research/<br><br>For #Enquiry:<br>Avail our services: https://www.phdassistance.com/services/phd-data-analysis/<br>To Contact Us:<br>UK: 44 7537144372<br>India: 91-9176966446tttt<br>Email: info@phdassistance.com

E N D
How to Interpret your regression output in management PhD research • An Academic presentation by • Dr. Nancy Agnes, Head, Technical Operations, Phdassistance • Group www.phdassistance.com • Email: info@phdassistance.com
Introduction Regression Analysis: An Overview • Regression analysis is a statistical tool for modelling and analyzing variable relationships. The primary purpose of regression analysis is to estimate the values of one variable (the dependent variable) using the values of other variables (the independent variables). The following are some important characteristics of regression analysis: • Dependent variable • Independent variables • Regression model • Model fitting Check our PhD Data Analysis examples to learn about how we review or edit an article for Data Analysis. contd...
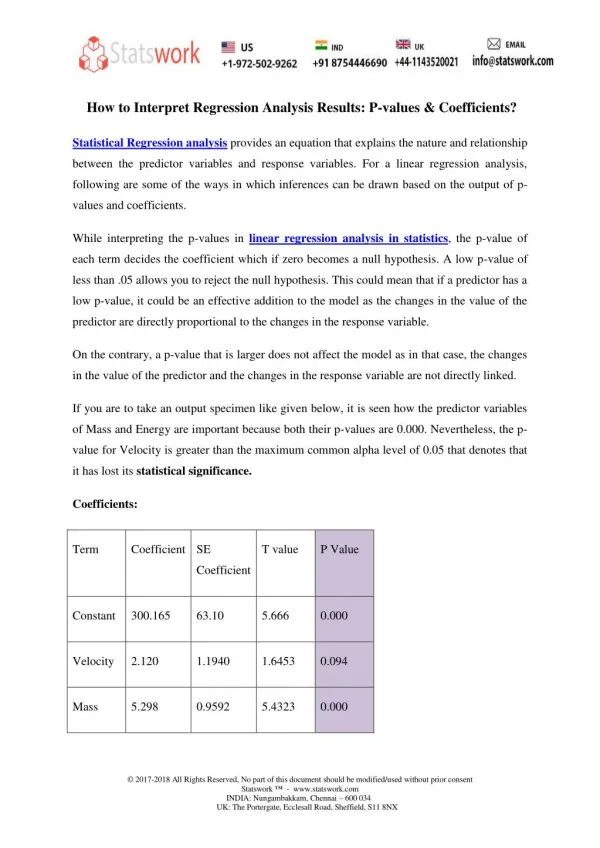
Coefficients: Look at the coefficients of the independent variables. These represent the estimated impact of each independent variable on the dependent variable, holding other variables constant. A positive coefficient indicates a positive relationship, while a negative coefficient suggests a negative relationship. • Significance Levels (p-values): Check the p-values associated with each coefficient. A low p-value (typically below 0.05) indicates that the variable is statistically significant. If a p-value is high, it suggests that you cannot reject the null hypothesis that the variable does not affect the dependent variable. • R-squared Value: Examine the R-squared value, which represents the proportion of the variance in the dependent variable explained by the independent variables. A higher R-squared indicates a better fit of the model to the primary data collection.
Adjusted R-squared: This value adjusts the R-squared for the number of predictors in the model. It's often considered a more reliable measure when comparing models with different numbers of predictors. • F-statistic: The F-statistic tests the overall significance of the logistic regression model. A low p-value for the F-statistic indicates that at least one independent variable is significantly related to the dependent variable. • Residuals Analysis: Examine the residuals (the differences between the observed and predicted values). A well-fitted model should have residuals that are randomly distributed and show no pattern. Patterns in residuals might suggest that the model is missing some explanatory variables.
Multicollinearity: Check for multicollinearity among independent variables. High correlation between independent variables can make it difficult to isolate the individual effect of each variable. • Heteroscedasticity: Assess whether the variance of the residuals is constant across all levels of the independent variables. Heteroscedasticity could indicate that the model's assumptions are not met. • Normality of Residuals: Verify that the residuals are normally distributed. You can use quantitative statistical tests or visual inspections (like a Q-Q plot) for this purpose. • Substantive Significance: Beyond statistical significance, consider the practical or managerial significance of your findings. Even if a variable is statistically significant, it may not be practically significant. Check out our study guide to learn more about What are the Struggles while Writing a Research Proposal.
About PhD Assistance • PhD assistance focuses on writing research proposals for Ph.D. degrees, which are crucial for the application process and are used by many international universities to determine acceptance offers for DBA/Doctoral programs. • They assist in framing these proposals according to standard guidelines and have assisted students from various countries, including the UK, USA, Netherlands, Australia, UAE, Dubai, Kenya, Nigeria, China, and Russia. • They adhere strictly to university guidelines and have a plagiarism and tolerance policy, ensuring original papers are sent to clients.
GET IN TOUCH UNITED KINGDOM +44 7537144372 INDIA +91-9176966446 EMAIL info@phdassistance.com