Download
1 / 53
530 likes | 909 Views
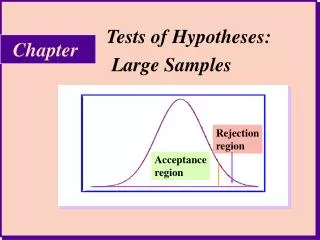
Tests of Hypotheses. Statistical hypothesis. Statistical hypothesis- Statement about a feature of the population (e.g. – the mean) Examples: - Mean temperature of healthy adults is 98.6°F (37°c). - A certain medication contains a mean of 245 ppm of a particular chemical.

E N D
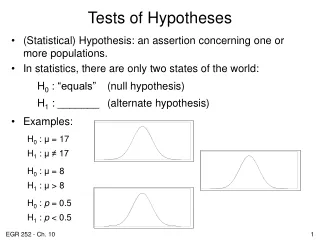
Statistical hypothesis Statistical hypothesis- Statement about a feature of the population (e.g. – the mean) Examples: - Mean temperature of healthy adults is 98.6°F (37°c). - A certain medication contains a mean of 245 ppm of a particular chemical. - Mean number of people that enter a certain restaurant in a day is 125.
Example – soft drink bottles A firm that produces a certain soft drink prints on each bottle that it contains 24 oz of drink. It has been suspected that the mean amount per bottle is less than 24 oz . In order to examine this claim, a sample of 100 bottles has been taken and the mean amount per bottle was found to be 23.4 oz. Assume that the standard deviation of the contents of the drink in the bottles is σ=3 oz. Is this an indication that the mean amount of drink in a bottle is less than 24 oz?
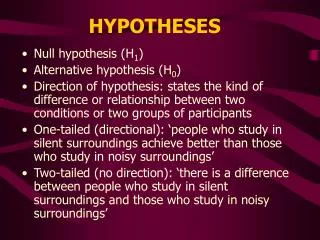
Set hypotheses: Two types of hypotheses: H0 - the null hypothesis Common beliefs, the claims that are assumed to be true up-to-date H0 - Mean contents of soft drink bottle, μ, is 24 oz (μ=24) H1- the alternative hypothesis Alternative claims that come to challenge the common beliefs H1 – mean contents of soft drink bottle, μ, is less than 24 oz (μ<24)
Sample results: • If is (i) small enough • (ii) large enough • we will reject H0. H0: μ=24 H1: μ<24
How likely are we to observe such result from a population with mean μ=24? The distribution of μ=24 oz
We are not very likely to observe such result from a population with μ=24 (prob=0.028)
Test statistic Z = -2 is an example of a test statistic It measures the distance of the sample results from what is expected if H0 is true.
Is the value Z=-2 unusual under H0? 0.0228 μ=24 oz There is only 0.0228 chance of getting values smaller than Z=-2 if H0 is true
P-value The probability of getting an outcome as extreme or more extreme than the observed outcome. “Extreme” – far from what we would expect if H0 were true. The smaller the p-value, the stronger the evidence against H0.
Level of significance α – significance level. It is the chance we are ready to take for rejecting H0 while in fact H0 is true if p-value≤ α, we say that we reject H0 at the α significance level. Typically, α is taken to be 0.05 or 0.01
In the bottles example: If we required a significance level of α=0.05 then we would reject H0 p-value=0.0228<0.05 However, if we required a significance level of α=0.01 then we would not reject H0 0.028 μ=24
Example – sales of coffee Weekly sales of regular ground coffee at a supermarket have in the recent past varied according to a normal distribution with mean μ=354 units per week and standard deviation σ=33 units. The store reduces the price by 5%. Sales in the next three weeks are: 405, 378, and 411 units. Is this good evidence, at the 5% significance level, that average sales are now higher? Hypotheses: H0: H1: Sample mean: μ=354 μ>354 How far is from what we expect if H0 is true?
μ=354 Test statistic: P-value: p-value=probability of getting values that are more extreme than the test statistic if H0 is true: p(Z≥2.31)=1-Ф(2.31)=1-0.9896=0.0104 Decision for α=0.05: P-value=0.0104< α We reject H0: There is evidence that sales have increased.
Example – systolic blood pressure The national center for health statistics reports that the mean systolic blood pressure for males 35 to 44 years of ages is 128 and the standard deviation in the population is 15. The medical director of a large company looks at the records of 72 executives in this age group and finds that the mean systolic blood pressure in this sample is . Is this evidence that the company’s executives have a different mean blood pressure from the general population? Hypotheses: H0: H1: no difference from the general population: μ=128 μ≠128 (2 sided hypothesis)
Test statistic: P-value: p-value=probability of getting values that are more extreme than the test statistic: p(Z≤-1.09)=0.1379 But our H1 hypothesis is two sided – we must also consider the probability that Z≥1.09 so p-value=2p(Z≤-1.09)=2(0.1379)=0.2758 0.1379 Z=-1.09 Z=1.09
Decision for α=0.05: P-value=0.2758>0.05 we do not reject H0. Therefore there is no strong evidence that executives differ from other men in their blood pressure
General rules for test of Hypotheses about the mean H0: μ=μ0 (known σ) Test statistic: H1: μ<μ0 P-value = p(Z≤z) H1: μ>μ0 P-value = p(Z≥z) H1: μ≠μ0 P-value = 2p(Z≥|z|) Z Z |Z|
Example – Obstetrics(branch of medicine concerned with birth of children) The mean birth weight in the US is 120 OZ. Suppose that in a sample of 100 full-term live-born deliveries in a hospital in a low socio-economic status area: Suppose also that the standard deviation of birth weight is σ=24 OZ. Examine whether the birth weight in low socio-economic status area is lower than the rest of the population. Hypotheses: H0: H1: Test statistic: μ=120 μ<120
P-value: Probability of getting values that are more extreme than the test statistic under H0. p-value=p(Z≤-2.083)=0.0188 Decision for α=5%: P-value=0.0188<α Reject H0. There is evidence that mean birth-weight of babies in the low socio-economic status area is smaller than mean birth weight of other babies. Decision for α=1%: P-value=0.0188>α Do not reject H0. There is no evidence to suspect that mean birth-weight of babies in the low socio-economic status area is smaller then mean birth weight of other babies.
Example – Nicotine The nicotine content in cigarettes of a certain brand is normally distributed with mean ( in milligrams) μ and standard deviation σ=0.1. The brand advertises that the mean nicotine content of its cigarettes is 1.5, but measurements on a random sample of 100 cigarettes of this brand gave a mean . Is this evidence ,at the 1% significance level, that the mean nicotine content is actually higher than advertised? Hypotheses: H0: H1: Test statistic: μ=1.5 μ>1.5
P-value= P-value: Probability of getting values that are more extreme than the test statistic under H0. p(Z≥3)=1-p(Z<3)=1-0.9987=0.0013 Decision for α=1%: P-value=0.0013< α Reject H0. There is evidence that the mean nicotine content is higher than advertised
Example – body temperature - Mean temperature of healthy adults=98.6°F (37°C) (found by Carl Wunderlich, German physician, 1868) - In 1992, a random sample of n=50 gave - Assume σ=0.67 Is there evidence, at the 0.01 significance level, to suspect that the mean temperature differ from 98.6°F? Hypotheses: H0: H1: μ=98.6 μ≠98.6
Test statistic: P-value: 2p(Z>|-3.9|)=2(1-Ф(3.9))=2(0.00012)=0.00024 Decision for α=0.01: P-value=0.00024< α We reject H0: The is evidence to suspect that the mean temperature differ from 98.6 -3.9 3.9
What is wrong with the following sets of Hypotheses? H0: H1: Answer: the hypotheses should be about μ ! H0: μ<5 H1: μ=5 Answer: the equal sign hypothesis should be in H0. H0: μ≠5 H1: μ=5 Answer: the equal sign hypothesis should be in H0. H0: μ=5 H1: μ<5 Answer: nothing is wrong
Testing hypotheses using a confidence interval: Example: A certain maintenance medication is supposed to contain a mean of 245 ppm of a particular chemical. If the concentration is too low, the medication may not be effective; if it is too high, there may be serious side effects. The manufacturer takes a random sample of 25 portions and finds the mean to be 247 ppm. Assume concentrations to be normal with a standard deviation of 5 ppm. Is there evidence that concentrations differ significantly (α=5%) from the target level of 245 ppm? Hypotheses: H0: μ=245 H1: μ≠245
First, lets examine the Z test statistic: Test statistic: P-value: 2P(Z>2)=2(0.0228)=0.0456 Decision at 5% significance level: P-value>α reject H0 The concentration differs from 245
Now, examine the hypotheses using a confidence interval α =0.05 confidence level is 1- α = 95% 95% CI: [245.04 , 248.96] We are 95% certain that the mean concentration is between 245.04 and 248.96. Since 245 is outside this CI - reject H0. The concentration differs from 245
Examine the hypotheses using a confidence interval H0: μ=μ0 H1: μ≠μ0 If μ0 is outside the confidence interval, then we reject the null hypothesis at the α significance level. Note: this method is good for testing two-sided hypotheses only [ confidence interval] μ0
Example Suppose a claim is made that the mean weight μ for a population of male runners is 57.5 kg. A random sample of size 24 yields . [σ is known to be 5 kg]. Based on this, test the following hypotheses: H0: μ=57.5 H1: μ≠57.5 Answer using: a) A Z test statistic b) A confidence interval
a) Test statistic: P-value: 2P(Z>2.45)=2(1-.9929)=2(.0071)=.0142 Decision at 5% significance level: P-value<α reject H0 Conclusion: Mean weight differs from 57.5
b) α =0.05 confidence level is 1- α = 95% 95% CI: [58 , 62] 57.5 is outside this CI - reject H0. Mean weight differs from 57.5 question?: Would you reject H0: μ=59 vs. H1: μ≠59? No, because 59 is in the interval [58, 62]
Example In a certain university, the average grade in statistics courses is 80, and σ=11. A teacher at that university wanted to examine whether her students received higher grades than the rest of the stat classes. She took a sample of 30 students and recorded their grades hypotheses: H0:μ=80 H1:μ>80 data are: mean: 95 100 82 76 75 83 75 96 75 98 79 80 79 75 100 91 81 78 100 72 94 80 87 100 97 91 70 89 99 54
Test statistic: P-value: P(Z>2.51)=1-0.9940=0.006 Decision at 5% significance level: P-value<α reject H0 conclusion: The grades are higher than 80
What happens when σ is unknown? We can estimate it from the sample: When the standard deviation is estimated from the sample, the test statistic is not Z: Or:
t-distribution • Symmetric around zero • Bell-shaped • Has wider tails than those of Z Z t(n-1) 0
t-distribution becomes more similar to Z as n increases: t(9) Z t(2)
Example During a recent water shortage in a southern city, the water company randomly sampled residential water consumption on a daily basis. A random sample of 20 residents revealed: , S=24.3 gallons. Suppose the mean water consumption before the water shortage was 250 gallons. Test, at the 5% significance level, whether there was a decrease in the mean daily consumption. Hypotheses: H0: H1: μ=250 μ<250
Test statistic: P-value: P(t(19)<-4.84) = t – table =P(t(19)>4.84) p-value < 0.0025 Decision for α=0.05: P-value<0.05 Reject the null hypothesis Conclusion: The daily consumption decreased below 250 gallons. -4.84
Example The mean age of all CEO’s for major corporations in the U.S was 48 years in 1991. A random sample of 25 CEO’s taken recently from major corporations showed that years, s=5 years. Assume that the age of CEO’s of major corporations have an approximate normal distribution. Would you conclude, at the 5% significance level, that the current mean age of all CEO’s of major corporations is not equal to 48?
μ=48 μ≠48 Hypotheses: H0: H1: Test statistic: P-value: 2P(t(24)<-2) = 2P(t(24)>2) t – table =2(0.025 to 0.05)= =0.05 to 0.1 Decision for α=0.05: P-value>0.05 Do not reject the null hypothesis Conclusion: The mean age of CEO’s of major companies is not different from 48 2 -2
Example The police department will be eligible for a new hire if they can produce convincing evidence that their response times to non-emergency crime call average more than 15 minutes. A random sample of 41 calls averaged 17 minutes, with standard deviation 6 minutes. Carry out a test and decide if they are eligible for the new hire.
μ=15 μ>15 Hypotheses: H0: H1: Test statistic: P-value: P(t(40)>2.13) = =( 0.01 to 0.025)= 0.01<p-value<0.025 Decision for α=0.05: P-value<0.05 Reject H0 Conclusion: The mean response time to non-emergency calls is greater than 15 – they are eligible for the new hire. 2.13
back to question1 back to question2 tα
Practice the t-table P(t(20)>1.325)= P(t(10)>2.870)= P(t(10)<-2.780)= P(t(10)>3.6)= P(t(10)<-3.6)= P(t(25)>2.51)=? P(t(9)<-2)=? P(t(19)<-4.84) tα 0.1 0.0083 0.0083 <0.0025 <0.0025 0.0083< P(t(25)>2.51) < 0.01 0.025< P(t(9)<-2) < 0.05 <0.0025
A confidence interval to the mean when σ is unknown When σ is known: When σ is unknown:
Testing hypotheses about the mean using confidence interval If μ0 is outside the CI reject H0 Confidence interval
T-test with Minitab Example: Most people believe that the mean age at which babies start to walk is one year. A A researcher thought that the mean age is higher. She took a sample of 10 babies and documented the age (in months) at which they started to walk. The data are: Examine the researcher’s claim (α=5%). mean: SD:1.633 12 11 13 14 15 13 12 11 16 13