Download
1 / 12
150 likes | 249 Views
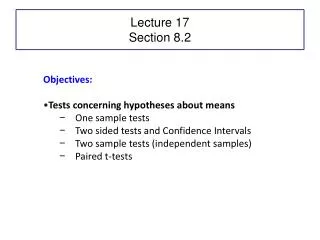
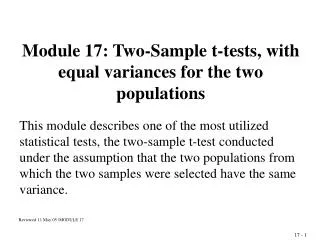
Chapter 10: One-Sample and Two-Sample Tests of Hypotheses. Walpole, Walpole, Myers, & Ye Probability and Statistics for Scientists and Engineers NINTH EDITION. Statistical Hypothesis Testing. A statistical hypothesis is an assertion concerning one or more populations.

E N D
Chapter 10: One-Sample and Two-Sample Tests of Hypotheses Walpole, Walpole, Myers, & Ye Probability and Statistics for Scientists and EngineersNINTH EDITION EGR 252 2019
Statistical Hypothesis Testing • A statistical hypothesis is an assertion concerning one or more populations. • In statistics, a hypothesis test is conducted on a set of two mutually exclusive statements: H0 : null hypothesis H1 : alternate hypothesis • Example H0 : μ = 17 H1 : μ ≠ 17 • We sometimes refer to the null hypothesis as the “equals” hypothesis. EGR 252 2019
Tests of Hypotheses - Graphics I • We can make a decision about our hypotheses based on our understanding of probability. • We can visualize this probability by defining a rejection region on the probability curve. • The general location of the rejection region is determined by the alternate hypothesis. H0 : μ = _____ H1 : μ < _____ H0 : p = _____ H1 : p > _____ H0 : μ = _____ H1 : μ ≠ _____ One-sided One-sided Two-sided EGR 252 2019
Choosing the Hypotheses • Your turn … Suppose a coffee vending machine claims it dispenses an 8-oz cup of coffee. You have been using the machine for 6 months, but recently it seems the cup isn’t as full as it used to be. You plan to conduct a statistical hypothesis test. What are your hypotheses? H0 : μ = _____ H1 : μ ≠ _____ H0 : μ = _____ H1 : μ < _____ EGR 252 2019
α Probability of committing a Type I error Probability of rejecting the null hypothesis given that the null hypothesis is true P (reject H0 | H0 is true) β Probability of committing a Type II error Power of the test = 1 - β (probability of rejecting the null hypothesis given that the alternate is true.) Power = P (reject H0 | H1 is true) Potential errors in decision-making EGR 252 2019
Hypothesis Testing – Approach 1 • Approach 1 - Fixed probability of Type 1 error. • State the null and alternative hypotheses. • Choose a fixed significance level α. • Specify the appropriate test statistic and establish the critical region based on α. Draw a graphic representation. • Calculate the value of the test statistic based on the sample data. • Make a decision to reject or fail to reject H0, based on the location of the test statistic. • Make an engineering or scientific conclusion. EGR 252 2019
Significance testing based on the calculated P-value State the null and alternative hypotheses. Choose an appropriate test statistic. Calculate value of test statistic and determine P-value. Draw a graphic representation. Make a decision to reject or fail to reject H0, based on the P-value. Make an engineering or scientific conclusion. One potential test result graphic: Hypothesis Testing – Approach 2 p = 0.025 ↓ P-value 0 1.00 P-value 0.75 0.25 0.50 EGR 252 2019
Significance testing based on the calculated P-value Two additional potential test results (vertical blue line represents a significance level of 0.05.): Additional Graphics – Approach 2 p = 0.45 ↓ P-value P-value 0 0.50 0.75 1.00 0.25 ↓p = 0.85 P-value 0 1.00 0.75 0.25 0.50 P-value EGR 252 2019
Hypothesis Testing Tells Us … • Strong conclusion: • If our calculated t-value is “outside” tα,ν (approach 1) or we have a small p-value (approach 2), then we reject H0: μ = μ0 in favor of the alternate hypothesis. • Weak conclusion: • If our calculated t-value is “inside” tα,ν (approach 1) or we have a “large” p-value (approach 2), then we cannot reject H0: μ = μ0. • Failure to reject H0 does not imply that μ is equal to the stated value (μ0), only that we do not have sufficient evidence to support H1. EGR 252 2019
Example: Single Sample Test of the Mean P-value Approach A sample of 20 cars driven under varying highway conditions achieved fuel efficiencies as follows: Sample mean x = 34.271 mpg Sample std dev s = 2.915 mpg Test the hypothesis that the population mean equals 35.0 mpg vs. μ< 35. Step 1: State the hypotheses. H0: μ = 35 H1: μ < 35 Step 2: Determine the appropriate test statistic. σ unknown, n = 20 Therefore, use t distribution EGR 252 2019
Single Sample Example (Approach 2) Approach 2 (p-value approach): = -1.11842 Find probability from Table A.4 or use Excel’s t.dist function. P(x ≤ -1.118) = T.DIST (-1.118, 19, TRUE) = 0.139665 p = 0.14 0__________1 p-value Decision: Fail to reject null hypothesis Conclusion: The mean is not significantly less than 35 mpg. Note: the conclusion “matches” the alternate hypothesis - H1: μ < 35 EGR 252 2019
Single Sample Example (Approach 1) Approach 1: Predetermined significance level (alpha) Step 1: Use same hypotheses. Step 2: Let’s set the significance level (alpha) at 0.05. Step 3: Determine the critical value of t that separates the reject H0 region from the do not reject H0 region. t, n-1 = t0.05,19 = 1.729 Since H1 format is “μ< μ0,” tcrit = -1.729 Step 4: tcalc = -1.11842 Step 5: Decision Fail to reject H0 Step 6: Conclusion: The population mean is not significantly less than 35 mpg. ***Do not conclude that the population mean equals 35 mpg.*** 0 EGR 252 2019