Download
1 / 1
10 likes | 244 Views
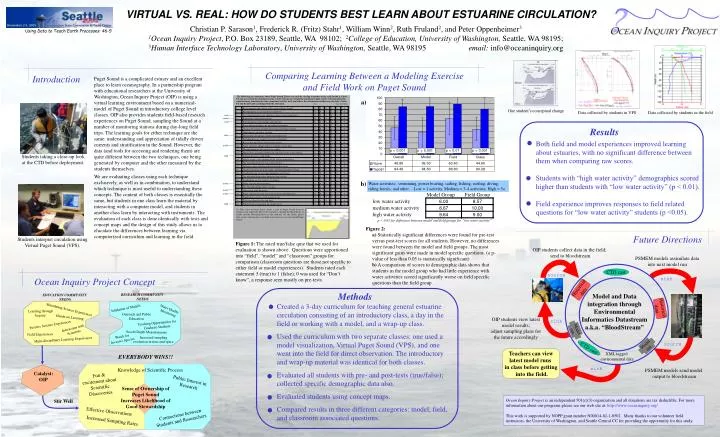
field. model. field. Results. Both field and model experiences improved learning about estuaries, with no significant difference between them when comparing raw scores. Students with “high water activity” demographics scored higher than students with “low water activity” (p < 0.01).

E N D
field model field Results Both field and model experiences improved learning about estuaries, with no significant difference between them when comparing raw scores. Students with “high water activity” demographics scored higher than students with “low water activity” (p < 0.01). Field experience improves responses to field related questions for “low water activity” students (p <0.05). field model field model model model field Future Directions EVERYBODY WINS!! Knowledge of Scientific Process Fun & excitement about Scientific Discoveries Public Interest in Research Created a 3-day curriculum for teaching general estuarine circulation consisting of an introductory class, a day in the field or working with a model, and a wrap-up class. Used the curriculum with two separate classes: one used a model visualization, Virtual Puget Sound (VPS), and one went into the field for direct observation. The introductory and wrap-up material was identical for both classes. Evaluated all students with pre- and post-tests (true/false); collected specific demographic data also. Evaluated students using concept maps. Compared results in three different categories: model, field, and classroom associated questions. Sense of Ownership of Puget Sound Increases Likelihood of Good Stewardship Effective Observations Connections between Students and Researchers Increased Sampling Rates VIRTUAL VS. REAL: HOW DO STUDENTS BEST LEARN ABOUT ESTUARINE CIRCULATION? Christian P. Sarason1, Frederick R. (Fritz) Stahr1, William Winn2, Ruth Fruland2, and Peter Oppenheimer3 1Ocean Inquiry Project, P.O. Box 23189, Seattle, WA 98102; 2College of Education, University of Washington, Seattle, WA 98195; 3Human Interface Technology Laboratory, University of Washington, Seattle, WA 98195 email: info@oceaninquiry.org Using Data to Teach Earth Processes: 46-5 Comparing Learning Between a Modeling Exercise and Field Work on Puget Sound Introduction Puget Sound is a complicated estuary and an excellent place to learn oceanography. In a partnership program with educational researchers at the University of Washington, Ocean Inquiry Project (OIP) is using a virtual learning environment based on a numerical-model of Puget Sound in introductory college level classes. OIP also provides students field-based research experiences on Puget Sound, sampling the Sound at a number of monitoring stations during day-long field trips. The learning goals for either technique are the same: understanding and appreciation of tidally driven currents and stratification in the Sound. However, the data (and tools for accessing and rendering them) are quite different between the two techniques, one being generated by computer and the other measured by the students themselves. We are evaluating classes using each technique exclusively, as well as in combination, to understand which technique is most useful to understanding these concepts. The content of both classes is essentially the same, but students in one class learn the material by interacting with a computer model, and students in another class learn by interacting with instruments. The evaluation of each class is done identically with tests and concept maps and the design of this study allows us to elucidate the differences between learning via computerized curriculum and learning in the field. a) One student’s conceptual change Data collected by students in VPS Data collected by students in the field Students taking a close-up look at the CTD before deployment. b) Water activities: swimming, power boating, sailing, fishing, surfing, diving, riding ferries, and other. Low = 1 activity, Medium = 3-4 activities, High = 5+ p < 0.05 for difference between model and field groups for “low water activity” • Figure 2: • a) Statistically significant differences were found for pre-test versus post-test scores for all students. However, no differences were found between the model and field groups. The most significant gains were made in model specific questions. (a p-value of less than 0.05 is statistically significant) • b) A comparison of scores to demographic data shows that students in the model group who had little experience with water activities scored significantly worse on field specific questions than the field group. Students interpret circulation using Virtual Puget Sound (VPS). Figure 1: The rated true/false quiz that we used for evaluation is shown above. Questions were apportioned into “field”, “model” and “classroom” groups for comparison (classroom questions are those not specific to either field or model experiences). Students rated each statement 5 (true) to 1 (false); 0 was used for “Don’t know”, a response seen mostly on pre-tests. OIP students collect data in the field; send to bloodstream PSMEM models assimilate data into next model run CTD cast source sink Ocean Inquiry Project Concept Historical data Methods Model and Data integration through Environmental Informatics Datastream a.k.a. “BloodStream” RESEARCH COMMUNITY NEEDS EDUCATION COMMUNITY NEEDS Historical data Validation of Models Water Quality Monitoring Stimulating Science Experiences Learning through Inquiry Outreach and Public Education Hands-on Learning OIP students view latest model results; adjust sampling plans for the future accordingly sink Teaching Opportunities for Graduate Students Positive Science Experiences Model run Interaction with Scientists Secchi Depth Measurements Field Experiences Watch for Invasive Species Increased sampling resolution in time and space Multi-disciplinary Learning Experiences source Model run CTD cast Teachers can view latest model runs in class before getting into the field. XML tagged environmental data sink PSMEM models send model output to bloodstream Catalyst: OIP Ocean Inquiry Project is an independent 501(c)(3) organization and all donations are tax deductible. For more information about our programs please see our web site at: http://www.oceaninquiry.org/ This work is supported by NOPP grant number N00014-02-1-0502. Many thanks to our volunteer field instructors, the University of Washington, and Seattle Central CC for providing the opportunity for this study. Stir Well