Download
1 / 136
1.36k likes | 1.9k Views
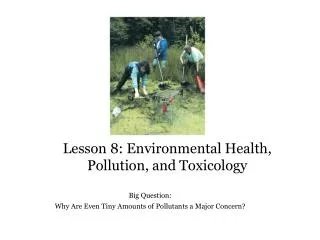
Slowly poisoned: health consequences of pollution and environmental toxins. Martin Donohoe, MD, FACP Portland State University Campaign for Safe Foods, Oregon Physicians for Social Responsibility. Overview. Public health approach Air pollution Garbage Toxins Education/Corporate Influence

E N D
Slowly poisoned: health consequences of pollution and environmental toxins Martin Donohoe, MD, FACP Portland State University Campaign for Safe Foods, Oregon Physicians for Social Responsibility
Overview • Public health approach • Air pollution • Garbage • Toxins • Education/Corporate Influence • Progress and Solutions
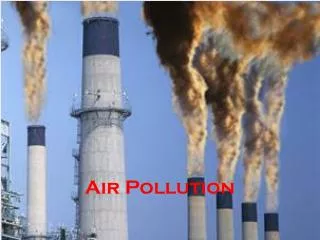
Some Major Sources of Air Pollution • Industry - #1 • Agriculture • Automobiles • Indoor combustion of coal and biomass for cooking, heating and food preservation
Air Pollution • Top ten most polluted cities in the world are in China and India • Most polluted areas in US: • LA, Houston, San Joaquin Valley in Central California, Pittsburgh
Health Effects of Air Pollution • Causes approximately 60,000 - 75,000 premature deaths/yr. in U.S. (656,000 in China) • More than are killed by auto accidents • 1.8 million worldwide
Health Effects of Air Pollution • Air pollution causes asthma and impairs lung development and function • Deaths from cardiopulmonary diseases correlate with air pollution levels in US cities • Both day to day and over time
Health Effects of Air Pollution • Increased admissions for CHF, asthma, COPD, PVD, and cerebrovascular disease (stroke and TIA) • Increased lung cancer mortality • Decreased exercise tolerance, increased pulmonary symptoms
Health Effects of Air Pollution • Increased risk of DVT • Impaired sperm production • Increase in SGA and LBW infants • Increased risk of appendicitis • ?Via link with inflammation? • Increased numbers of migraines
Effects of Ozone Destruction • Ozone hole over Antarctic (2½X size of Europe) • Increased cataracts (UV damage) • Increased lifetime melanoma risk • 1/1500 - 1930 • 1/68 - today
Automobiles • Number of autos-US: 1 car/2 people-Mexico: 1/8-China: 1/100 (increasing; leaded gasoline) • Global auto population to double in 25-50 years
Automobiles • Average miles traveled/car/year in U.S. • 1965 - 4,570 mi. • 1975 - 6,150 mi. • 1985 - 7,460 mi. • 1995 - 9,220 mi. • 2008 – 12,000 mi.
Automobiles • 25 lbs. of CO2 produced for every gallon of gasoline manufactured, distributed, and then burned in a vehicle • U.S. energy costs exceed $500 billion/yr. (plus military costs to keep foreign oil flowing)
Automobiles • Average fuel efficiency of U.S. autos stagnant • Ford Model T – 25 mpg (1908); Avg. Ford vehicle – 22.6 mpg (2003) • Cars: 27.5 mpg required by 2011, 37.5 mpg required by 2015 • Light trucks / SUVs: 23.5 mpg by 2011, 28.6 mpg by 2015 • European and Japanese standards higher
Automobiles: Alternatives • Relatively low oil prices (until recently) • Growing market (until recently) for low-efficiency pickups, minivans, and SUVs • Rapid transit • Electric cars • killed by oil companies, automakers, tire manufacturers in early 20th century • Convicted under Sherman Antitrust Act
Automobiles: Alternatives • Car sharing • Pay-as-you-drive auto insurance • “Peak Pricing” and “Congestion Fees” • E.g., London → 21% decrease in traffic, 43% increase in bus ridership, cleaner air • Bicycles/walking • 30% of all trips by bike in Amsterdam; 2% in Portland, OR
Automobiles: Alternatives • Busses • Trains • 15 x more efficient per passenger than autos • Natural gas and/or gasohol-generate less CO2
Automobiles: Alternatives • Telecommuting • Biodiesel • Vegetable oil-based fuel • Problem: Cheapest biodiesel is oil from palm trees; Indonesia, Malaysia deforesting areas to plant palm trees, leading to increase in global CO2
Automobiles: Alternatives • Solar cars • Hydrogen-powered cars • Byproduct = water • Problem: Hydrogen production requires fossil fuels
Energy Spending/Research • Since 1947, the U.S. has spent $145 billion on nuclear R and D vs. $5 billion on renewables R and D • < 5% of the DOE’s budget pays for energy efficiency and renewables • BP invests $100 million annually in clean energy = amt. it spends annually to market its new name and environmentally-friendly image of moving “Beyond Petroleum”
Garbage • 98% of the country’s total refuse is industrial waste; 2% municipal waste • American produce 4.4 lbs/d garbage • In a lifetime, the average American will throw away 6500 times his/her adult weight in garbage
Garbage • In one year, Americans generate 236 million tons of garbage • 30% recycled • 164 million tons thrown away
U.S. Garbage Composition • Paper and Paperboard - 39% • Yard Waste - 13% • Food Waste - 10% • Plastics - 12% • Metals - 8% • Glass - 6% • Wood - 5%
U.S. Recycling Rates • Tires - 22% • Plastic containers - 25% • Overall plastics – 5% • Glass containers - 28% • Yard waste - 41% • Paper and Paperboard - 42% • Aluminum packaging - 54% • Steel cans - 60% • Auto batteries - 93%
Garbage • Landfills (2300 in US) • Incinerators • Garbage exports
Annual World Production of Synthetic Organic Chemicals • 1930 - 1 million tons • 1950 - 7 million tons • 1970 - 63 million tons • 1990 - 500 million tons • 2000 - 1 billion tons
Toxins • 6 trillion tons of over 85,000 chemicals produced annually • more than 90% have never been screened for toxicity • Chemical manufacturers are not required to prove safety • the legal burden is on the government to prove that a product is dangerous • Consequence of 1976 Toxic Substances Control Act • Consumer Product Safety Commission has failed in its regulatory responsibilities
Toxic Pollutants • 85,000 known or suspected hazardous waste sites in the U.S. • Plus up to 600,000 lightly contaminated former industrial sites (“brownfields”) • EPA estimates that there will be 217,000 new hazardous waste sites by 2033 • Will cost hundreds of billions of dollars to mitigate environmental impacts
Toxic Pollutants • 1 in 4 U.S. citizens lives within 4 mile of a Superfund site (approximately 1,305 sites listed; another 2,500 sites eligible) • Taxpayers paying increasing share of cleanup costs • 54% in 2003 • Vast majority presently • Overall funding decreasing
Toxins • Body burden of industrial chemicals, pollutants and pesticides high • Environmental Working Group (2004)found 287 pesticides, consumer product ingredients, and wastes from burning coal, gasoline, and garbage in umbilical cord blood • Many other compounds not even tested; numbers undoubtedly higher
Fetuses and Children are Most Vulnerable to Toxins • Greater pound-for-pound exposure • Immature, porous blood brain barrier • Lower levels of chemical binding proteins, allowing more chemicals to reach “target” organs
Fetuses and Children are Most Vulnerable to Toxins • Organs/organ systems rapidly developing, thus more vulnerable to damage • Systems that detoxify and excrete industrial chemicals are not fully developed • Longer future life span allows more time for adverse effects to arise
Toxins in breast milk • Human babies at the top of the food chain • Fat soluble toxins concentrated in breast milk • Benefits of breast feeding still exceed risks • Birth defects, learning disabilities increasing • Toxins play important role
Toxins and gender • Sex ratio changing: • Normal = 105 boys/girls born (skewed by early male mortality) • Fewer boys being born in industrialized countries • Other causes include obesity, older parental age, stress, fertility aides
Pesticides • 2.2 billion lbs/yr pesticides • Including agricultural pesticides, wood preservatives, and disinfectants • 8.8 lbs/person/yr in US
Pesticides • EPA estimates U.S. farm workers suffer up to 300,000 pesticide-related acute illnesses and injuries per year • Possibly linked to higher rates of sarcoidosis in agricultural workers • Pesticide-exposed men have impaired semen quality, which is associated with reduced fertility and testicular cancer
Pesticides • NAS estimates that pesticides in food could cause up to 1 million cancers in the current generation of Americans • Linked to autism, Parkinson’s Disease, diabetes, obesity (with prenatal exposure), depression • Children living on or near farms score 5 points lower on IQ tests and other mental and verbal tests • May be due to pesticide exposure
Anthropological Study of Children Exposed to Pesticides Children from villages practicing organic agriculture Children from villages practicing non-organic agriculture
Pesticides • 1,000,000 people killed by pesticides over the last 6 years (WHO) • US health and environmental costs $12 billion/yr (2005)
Pesticides • CA and NY are the only states currently tracking pesticide sales and use • 2008: USDA axes national survey charting pesticide use • EPA, NAS currently allows pesticide testing in humans, despite strong opposition
Pesticides • $2.4 billion worth of insecticides and fungicides sold to American farmers each year • Pesticide runoff contributes to coastal dead zones • Baltic Sea, Mouth of Mississippi in Gulf of Mexico • Red tides • Pesticides inhibit nitrogen fixation, decrease crop yields
Pesticides • Evidence suggests that pesticides promote pests (vs. natural pesticides) • 30% of medieval crop harvests were destroyed by pests vs. 35-42% of current crop harvests • Implies organic farming more cost-effective
Pesticides and Produce • The Dirty Dozen: peaches, apples, bell peppers, celery, nectarines, strawberries, cherries, kale, lettuce, grapes (imported), carrots, pears • The Clean 15: onions, avocados, sweet corn, pineapples, mangos, asparagus, sweet peas, kiwis, cabbages, eggplant, papayas, watermelon, broccoli, tomatoes, sweet potatoes
Lead • 2 million US children with elevated levels • 120 million people with level > 10mcg/dL worldwide • Due to increased environmental exposure and, possibly, early umbilical cord clamping • #s affected dropping