Download
1 / 35
350 likes | 549 Views
Internet very diverse - no single path typical ... Now monitoring from 14 sites in 8 countries monitoring > 500 links in 22 countries (> 300 sites) Resources: ...

E N D
Slide 1:ESnet End-to-end Internet Monitoring
Les Cottrell and Warren Matthews, SLAC and David Martin, HEPNRC Presented at the ESSC Review Meeting, Berkeley, May 1998 Partially funded by DOE/MICS Field Work Proposal on Internet End-to-end Performance Monitoring (IEPM)
Slide 2:Outline of Talk
Why are we (ESnet/HENP community) measuring? What are we measuring & how? What do we see? What does it mean? Summary Deployment/development, Internet Performance, Next Steps Collaborations Won�t talk about actual tools, only briefly cover the method, also will mainly dwell on long term trend reports and how we use the results of the tools to better understand the Internet..Won�t talk about actual tools, only briefly cover the method, also will mainly dwell on long term trend reports and how we use the results of the tools to better understand the Internet..
Slide 3:Why go to the effort?
Internet woefully under-measured & under-instrumented Internet very diverse - no single path typical Users need end-to end measurements for: realistic expectations, planning information guidelines for setting and validating SLAs information to help in identifying problems help to decide where to apply resources Complements ESnet utilization measurements Provides information for reporting problems to NOC Demands are driven by: increase in number of users, increase in power available at desktop and in servers, newer applications (more graphics based, video, voice etc.), need for better QoS. Since it is driven largely by user needs all the data is made publicly available via the Web.Demands are driven by: increase in number of users, increase in power available at desktop and in servers, newer applications (more graphics based, video, voice etc.), need for better QoS. Since it is driven largely by user needs all the data is made publicly available via the Web.
Slide 4:Our Main Tool (PingER) is Ping Based
�Universally available�, easy to understand no software for clients to install Low network impact Provides useful real world measures of response time, loss, reachability, unpredictability Now monitoring from 14 sites in 8 countries monitoring > 500 links in 22 countries (> 300 sites) Resources: 6bps/link, ~600kBytes/month/link The scarcest and most valuable commodity is time. Studies in late 70�s and early 80s by Walt Doherty of IBM and others showed the economic value of Rapid Response Time: 0-0.4s High productivity interactive response 0.4-2s Fully interactive regime 2-12s Sporadically interactive regime 12s-600s Break in contact regime >600s Batch regime There is a threshold around 4-5s where complaints increase rapidly. For some newer Internet applications there are other thresholds, for example for voice a threshold appears at about 100ms - above that point, the delay causes difficulty for people trying to have a conversation and frustration grows. Note that the TCP/IP timeout caused by a packet loss is of the order of 4-5 seconds. For some newer Internet applications there are other thresholds, for example for voice a threshold appears at about 100ms - above that point, the delay causes difficulty for people trying to have a conversation and frustration grows Avoid routers, they drop pings to the router if busy. Prefer lightly loaded or consistently loaded hosts, e.g. name server, mail gateway. Some sites block ping (ping o� death attacks), others (singaren.net.sg) only allow 64 byte pings.The scarcest and most valuable commodity is time. Studies in late 70�s and early 80s by Walt Doherty of IBM and others showed the economic value of Rapid Response Time: 0-0.4s High productivity interactive response 0.4-2s Fully interactive regime 2-12s Sporadically interactive regime 12s-600s Break in contact regime >600s Batch regime There is a threshold around 4-5s where complaints increase rapidly. For some newer Internet applications there are other thresholds, for example for voice a threshold appears at about 100ms - above that point, the delay causes difficulty for people trying to have a conversation and frustration grows. Note that the TCP/IP timeout caused by a packet loss is of the order of 4-5 seconds. For some newer Internet applications there are other thresholds, for example for voice a threshold appears at about 100ms - above that point, the delay causes difficulty for people trying to have a conversation and frustration grows Avoid routers, they drop pings to the router if busy. Prefer lightly loaded or consistently loaded hosts, e.g. name server, mail gateway. Some sites block ping (ping o� death attacks), others (singaren.net.sg) only allow 64 byte pings.
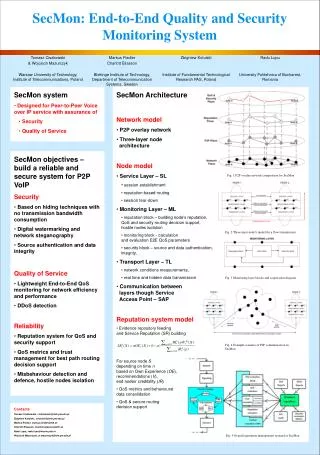
Slide 5:Measurement Architecture
WWW Archive Monitoring Monitoring Monitoring Remote Remote Remote Remote HEPNRC Archive Reports & Data Cache Monitoring SLAC Ping HTTP Analysis About 500 links involving 22 countries ESnet/HENP Collection at 14 sites in 8 countries CA, CH, DE, HU, IT, JP, UK, US About 500 links involving 22 countries ESnet/HENP Collection at 14 sites in 8 countries CA, CH, DE, HU, IT, JP, UK, US
Slide 6:Ping Loss Quality
Want quick to grasp indicator of link quality Loss is the most sensitive indicator Studies on economic value of response time by IBM showed there is a threshold around 4-5secs where complaints increase. loss of packet requires ~ 4 sec TCP retry timeout For packet loss we use following thresholds: 0-1% = Good 1-2.5% = Acceptable 2.5%-5% = Poor 5%-12% = Very Poor > 12% = Bad (unusable for interactive work) Above 4-6% packet loss video conferencing becomes irritating, and non native language speakers become unable to communicate. The occurrence of long delays of 4 seconds or more at a frequency of 4-5% or more is also irritating for interactive activities such as telnet and X windows. Above 10-12% packet loss there is an unacceptable level of back to back loss of packets and extremely long timeouts, connections may start to get broken, and video conferencing is unusable. Above 4-6% packet loss video conferencing becomes irritating, and non native language speakers become unable to communicate. The occurrence of long delays of 4 seconds or more at a frequency of 4-5% or more is also irritating for interactive activities such as telnet and X windows. Above 10-12% packet loss there is an unacceptable level of back to back loss of packets and extremely long timeouts, connections may start to get broken, and video conferencing is unusable.
Slide 7:Quality Distributions from SLAC
ESnet median good quality Other groups poor or very poor Poor performance of non Esnet sites (seen from SLAC) due to poor performance as traverse interchanges between ESnet & rest of InternetPoor performance of non Esnet sites (seen from SLAC) due to poor performance as traverse interchanges between ESnet & rest of Internet
Slide 8:Aggregation/Grouping
Critical for 14 monitoring sites & > 500 links Group measurements by: area (e.g. N. America W, N. America E, W. Europe, Japan, Asia, others, or by country, or TLD) trans-oceanic links, intercontinental links, crossing IXP ISP (ESnet, vBNS/I2, TEN-34...) by monitoring site one site seen from multiple sites common interest/affiliation (XIWT, HENP, Expmt �) Beware: reduces statistics, choice of sites critical
Slide 9:Tabular Navigation Tool
Select grouping, e.g. Intercontinental, TLDs, Site to site ... Select metric Response, Loss, Quiescence, Reachability ... Select month Goes back to Jul-97 Colored by quality < 62.5ms excellent (white) <125ms good (green) < 250ms poor (yellow) <500ms very poor (pink) >500ms bad (red) Drill down Site to show all sites monitoring it Value to see all links contributing MouseOver To see number of links To see country To see monitoring site Remote site Monitoring site , Can select monthly medians going back many months for groups of sites by: clicking on number in row/col box to get all links contributing headings Mouse over red dots on top romw to see monitoring host red dots on TLD to see name of country push pin to see number of links contributing Can select monthly medians going back many months for groups of sites by: clicking on number in row/col box to get all links contributing headings Mouse over red dots on top romw to see monitoring host red dots on TLD to see name of country push pin to see number of links contributing
Slide 10:Drill down (all sites monitoring CERN)
CMU CMU CNAF RL FNAL SLAC DESY DESY Carelton RMKI RMKI CERN KEK Select one of these groups Also provides Excel for DIY Sort Allow user to select which group of links (out of > 500) to display results for Note some collection sites ping multiple hosts at a given site. Checks for consistencyAllow user to select which group of links (out of > 500) to display results for Note some collection sites ping multiple hosts at a given site. Checks for consistency
Slide 11:For about 80 remote sites seen from SLAC Response time improved between 1 and 2.5% / month Loss - similar (closer to 2.5%/month)
Overall Improvements Jan-95 Nov-97 Prime time 7am - 7pm weekday seen from SLAC. Increase in international response caused by addition of IHEP, Novosibirsk, FZU (in CZ). If we remove these additions we get just under 1% improvement/month (I.e. pretty much like the others). This points out the need to examine results for biases.Prime time 7am - 7pm weekday seen from SLAC. Increase in international response caused by addition of IHEP, Novosibirsk, FZU (in CZ). If we remove these additions we get just under 1% improvement/month (I.e. pretty much like the others). This points out the need to examine results for biases.
Slide 12:How does it look for ESnet Researchers getting to US sites (280 links, 28 States)?
Within ESnet excellent (median loss 0.1%) To vBNS sites very good (~ 2 * loss for ESnet) DOE funded Universities not on vBNS/ESnet acceptable to poor, getting better (factor 2 in 6 months) lot of variability (e.g.) BrownT, UMassT = unacceptable(>= 12%) Pitt*, SC*. ColoState*, UNMT, UOregonT, Rochester*, UC*, OleMiss*, Harvard1q98, UWashingtonT, UNMT= v. poor(> 5%) SyracuseT, PurdueT, Hawaii* = poor (>= 2.5%) *=no vBNS plans, T= vBNS date TBD, V=on vBNS
Slide 13:University access changes in last year
A year ago we looked at Universities with large DOE programs Identified ones with poor (>2.5%) or worse (>5%) performance UOregonT, Harvard1q98, UWashingtonT = very poor (>= 5%) JHUV, DukeV, UCSDV, UMDV, UMichT, UColoV, UPennT, UMNV, UCIT, UWiscV = acceptable (>1%)/good *=no vBNS plans, T= vBNS date TBD, V=on vBNS
Slide 14:Canada
20 links, 9 remote sites, 7 monitoring sites Seems to depend most on the remote site UToronto bad to everyone Carleton, Laurentian, McGill poor Montreal, UVic acceptable/good TRIUMF good with ESnet, poor to CERN
Slide 15:Europe
Divides up into 2 TEN-34 backbone sites (de, uk, nl, ch, fr, it, at) within Europe good performance from ESnet good to acceptable, except nl, fr (Renater) & .uk are bad Others within Europe performance poor from ESnet bad to es, il, hu, pl acceptable for cz
Slide 16:Asia
Israel bad KEK & Osaka good from US, very poor from Canada Tokyo poor from US Japan-CERN/Italy acceptable, Japan-DESY bad FSU bad to Moscow, acceptable to Novosibirsk China is bad everywhere
Looks pretty bad for intercontinental use Improving (about factor of 2 in last 6 months)Slide 17:
Intercontinental Grouping (Loss)
Slide 18:Deployment Development ESnet/HENP/ICFA has 14 Collection sites in 8 countries collecting data on > 500 links involving 22 countries HEPNRC archiving/analyzing, SLAC analyzing 600KB/month/link, 6 bps/link, .25 FTE @ archive site, 1.5-2.5 FTE on analysis reports available worldwide to end-users to access, navigate, review & customize (via Excel) & see quality 4GBytes of data available to experts for analysis tools available for others to monitor, archive, analyze XIWT/IPWT chose & deployed PingER ~ 10 collection sites are now monitoring 41 beacon sites
Summary 1/5 XIWT/IPWT want to: Measure performance of members' own networks Get tests to validate and understand what to recommend to other commercial customers and for what purposes. Build a community within XIWT so can evolve it to address harder issues. Have chosen the PingER tools for deployment Collection sites (mar-98): West Group, Bell South (2), Digital (2), HP, Intel, Hughes, NIST, SBC They are looking for an analysis/archive site SAS/Oracle can cost several tens of thousands of dollars Need indexing for rapid lookup Usually a bit of overkill as an analysis tool (don�t use much in the way of sophisticated statistics). XIWT/IPWT want to: Measure performance of members' own networks Get tests to validate and understand what to recommend to other commercial customers and for what purposes. Build a community within XIWT so can evolve it to address harder issues. Have chosen the PingER tools for deployment Collection sites (mar-98): West Group, Bell South (2), Digital (2), HP, Intel, Hughes, NIST, SBC They are looking for an analysis/archive site SAS/Oracle can cost several tens of thousands of dollars Need indexing for rapid lookup Usually a bit of overkill as an analysis tool (don�t use much in the way of sophisticated statistics).
Slide 19:Summary 2/5
Deployment Development Next Steps Improve tools: Improve statistical robustness - Poisson sampling, medians More groupings, beacon sites, matched pairs, for comparison More navigation features to drill down Better/easier identification of common bottlenecks Prediction (extrapolations, develop models, configure and validate with data) Pursuing deployment of dedicated PC based monitor platforms: IETF Surveyor & NIMI/LBNL NIMIs up & running at PSC, LBNL, FNAL, SLAC, CERN (CH), working with RAL (UK), KEK (JP), DESY (DE) Will provide throughput, traceroute & one way ping measurements
Slide 20:Summary 3/5
Deployment Development Next Steps Internet Performance (summary for our 500 links) Performance within ESnet is good Performance to vBNS good (median loss ~ 2* ESnet) Performance to non ESnet/vBNS sites is acceptable to poor Intercontinental performance is very poor to bad Response time improving by 1-2% / month Packet loss improving between SLAC & other sites by 3% / month since Jan-95, Very dynamic
Slide 21:Summary 4/5
Deployment Development Next Steps Internet Performance (continued): Links to sites outside N. America vary from good (KEK) to bad Canada a mixed bag, depending on remote site it is acceptable to bad TEN-34 backbone countries (exc UK) good to acceptable Otherwise Europe poor to bad Asia (apart from some Japanese sites) is bad Rest of world generally poor to bad. Provide monthly summary tables with lots of statistical measures to allow faster generation of long term reports, and more robust metrics Extend grouping, e.g. by AS, country, time zones crossed, more geographic regions, user selectable, by experiment, by community, by collection site Summaries (c.f. Weather Map, top 10s, weekly, Consumer Reports) Provide monthly summary tables with lots of statistical measures to allow faster generation of long term reports, and more robust metrics Extend grouping, e.g. by AS, country, time zones crossed, more geographic regions, user selectable, by experiment, by community, by collection site Summaries (c.f. Weather Map, top 10s, weekly, Consumer Reports)
Slide 22:Summary 5/5
Deployment Development Next Steps Internet Performance Lots of collaboration & sharing: SLAC & HEPNRC leading effort on PingER 14 monitoring sites, ~ 400 remote sites Monitoring site tools CERN & CNAF/INFN, Oxford/TracePing MapPing/MAPNet working with NLANR TRIUMF Traceroute topology Map NIMI/LBNL & Surveyor/IETF/IPPM Industry: XIWT/IPWT, also SBIR from NetPredict on prediction Talks at IETF, XIWT, ICFA, ESSC, ESCC, Interface�98, CHEP� Lots of support: DOE/MICS/ESSC/ESnet, ICFA, XIWT
Slide 23:More Information & extra info follows
ICFA Monitoring WG home page (links to status report, meeting notes, how to access data, and code) http://www.slac.stanford.edu/xorg/icfa/ntf/home.html WAN Monitoring at SLAC has lots of links http://www.slac.stanford.edu/comp/net/wan-mon.html Tutorial on WAN Monitoring http://www.slac.stanford.edu/comp/net/wan-mon/tutorial.html PingER History tables http://www.slac.stanford.edu//xorg/iepm/pinger/table.html NIMI http://www.psc.edu/~mahdavi/nimi_paper/NIMI.html
Slide 24:Perception of Packet Loss
Above 4-6% packet loss video conferencing becomes irritating, and non native language speakers become unable to communicate. The occurrence of long delays of 4 seconds or more at a frequency of 4-5% or more is also irritating for interactive activities such as telnet and X windows. Above 10-12% packet loss there is an unacceptable level of back to back loss of packets and extremely long timeouts, connections start to get broken, and video conferencing is unusable.
Slide 25:180 Day Ping Performance SLAC-CERN
Slide 26:Running 10 week averages
Sorted on biggest change Standard deviation gives idea of loading
Slide 27:Quiescence
Frequency of zero packet loss (for all time - not cut on prime time)
Slide 28:Response & Loss Improvements
Improved between 1 and 2.5% / month Response & Loss similar improvements
Diagonals are within TLD US good/accept for it, de, ch & cz Hungary is poor China unusable Canada poor to bad UK - US badSlide 29:Top Level Domain Grouping (Loss)
UK-UK looks good. W. Europe-UK good to acceptable, W. Europe to Benelux abd Spain good to acceptable, but from US is bad KEK looks good, but rest of Japan is bad US to SU is good, bad from most of W. Europe China bad all overUK-UK looks good. W. Europe-UK good to acceptable, W. Europe to Benelux abd Spain good to acceptable, but from US is bad KEK looks good, but rest of Japan is bad US to SU is good, bad from most of W. Europe China bad all over
Slide 30:US ESnet & vBNS
ESnet Median 0.1% Links 36 Unique remote sites 17 Monitoring sites 6 vBNS Median 0.3% Links 30 Unique remote sites 18 Monitoring sites 4 .EDU, non ESnet/vBNS Median 1.5% (avg 3.2%) Links 54 Unique remote sites 36 Monitoring sites 3 Monitoring sites BNL, HEPNRC, SLAC, CERN ESnet 8% improvement/month, vBNS improving 0.1%/month ESnet vBNS .edu (non VBNS/Esnet) Median 0.1% Median 0.3% Median 1.5%(3.2% av) Links 36 Links 30 Links 54 Unique remote sites 17 Unique remote sites 18 Unique remote sites 36 Monitoring sites 6 Monitoring sites 4 Monitoring sites 3 Monitoring sites BNL, HEPNRC, SLAC, CERN ESnet 8% improvement/month, vBNS improving 0.1%/month ESnet vBNS .edu (non VBNS/Esnet) Median 0.1% Median 0.3% Median 1.5%(3.2% av) Links 36 Links 30 Links 54 Unique remote sites 17 Unique remote sites 18 Unique remote sites 36 Monitoring sites 6 Monitoring sites 4 Monitoring sites 3
Slide 31:CERN doubled capacity to US in Oct-97. INFN alsomincreased capacity about same time CERN doubled capacity to US in Oct-97. INFN alsomincreased capacity about same time
Slide 32:CERN doubled capacity to US in Oct-97. INFN alsomincreased capacity about same timeCERN doubled capacity to US in Oct-97. INFN alsomincreased capacity about same time
Loss Loss Delay Delay Advanced to U Chicago U Chicago to AdvancedSlide 34:MapPing
Java Applet, based on MapNet from NLANR Colors links by performance Selection: collection site performance metric month zoom level Mouse over gives coords
Slide 35:Traceroute Topology Tool
Reverse traceroute servers Traceping TopologyMap Ellipses show node on route Open ellipse is measurement node Blue ellipse not reachable Keeps history From TRIUMF KEK FNAL DESY CERN