Download

1 / 34
340 likes | 502 Views
The Effectiveness of Bank Stabilization Techniques for Reducing Erosion. Initiated in 1996 by ARCO Environmental Remediation, L.L.C. (AERL) and the Riparian and Wetland Research Program (RWRP) at the University of Montana. Paul Hansen, Donna DeFrancesco, Stephen Clayton,

E N D
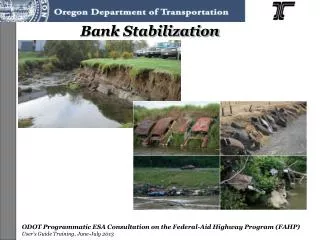
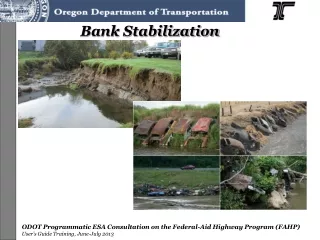
The Effectiveness of Bank Stabilization Techniques for Reducing Erosion
Initiated in 1996 by ARCO Environmental Remediation, L.L.C. (AERL) and the Riparian and Wetland Research Program (RWRP) at the University of Montana. Paul Hansen, Donna DeFrancesco, Stephen Clayton, Patricia Hettick, Timothy Weisenberger, Brendan Moynahan, and Ken Miller
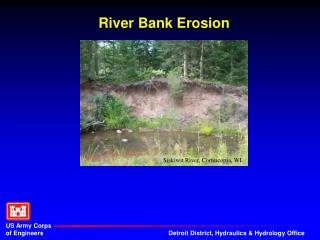
Objective To evaluate the effectiveness of various streambank stabilization techniques for reducing bank erosion on the upper Clark Fork River. Focus on bioengineering and the use of native riparian vegetation instead of traditional “hard” treatments such as riprap.
Study areas 5,708 ft treated and monitored 21 different bank stabilization treatments 24 treatment areas
Treatment elements • Vegetative plantings • Log barbs, • Root wads, • Douglas fir revetments • Coir fascines • Rock barbs • Sod mats • Rocky Mountain juniper revetments • Willow/red-osier dogwood fascines • Layered and non-layered coir (coconut husk) fabric
Treatment elements Vegetative plantings • Container vegetation • Willow cuttings • Mature willow transplants
Treatment Combinations Installed Fall 1996 Spring 1997 Summer 1997 Fall 1998
9,505 ft monitored as controls 7 control reaches
Field Methods Channel cross-sections Surface volume measurements Vegetation survival Treatment cost analyses
Measured 140 permanent cross-sections Post-ice flow Post peak flow 1996 1997 1998
General cross-sectional results All treatments experienced a higher rate of erosion as a result of the 1997 peak flow event than due to the 1998 peak flow event or the 1997 or 1998 ice events. There was no significant lateral erosion as result of ice events in either 1997 or 1998.
Rate of bank erosion 1996-1998 Reference reach -0.02 ft/yr Control reaches -1.1 ft/yr (-5.9 to +0.5) Treatment reaches -1.5 ft/yr (-4.6 to +0.8)
Treatment Reach Volumetric Changes Losing Treatments lateral erosion Container plantings -5.9 Juniper revetments/willow stakes -3.7 Coir fabric/willow poles -2.1 Coir fascine/container plants -1.8 Container plantings -1.8 Coir fabric/willow poles/log barbs -1.6
Container plantings treatment 1997 1998
Gaining/Static Treatment (ft/yr) Coir fabric/rock barbs/rock toe/container plants +0.1 Coir fabric/coir fascine/container plants 0 Coir fabric/willow-dogwood fascine toe/ container plantings 0 Coir fabric/willow poles +0.5
Surface profiles Volumetric analysis of treatment and control areas Utilizes electronic surveying tools and GIS capabilitie (ArcInfo, ArcView, and Spatial Analyst) Used to detect change in volume of eroding bank over time First completed in this study in 1998
100 bank surface profiles (13,000 + ft of riverbank) monitored with an electronic total station March 1998 August 1998
Before construction Afterconstruction
Riverbank volume changes 1998 Reference reach + 3 cu yds +0.14cu yds/sq yd Control reaches -56 cu yds average -0.13 cu yds/sq yd (6) (-402 to +162 cu yds) Treatment reaches -4 cu yds average -0.03 cu yds/sq yd (14) (-117 to +98 cu yds)
Treatment Reach Volumetric Changes Losing Treatments Overall volume vol/area Container plantings -59 cu yds -0.30 Mat. transplants/ willow stakes -117 cu yds -0.26 Coir fascine/container plants -64 cu yds -0.17 Coir fabric/willow poles/log barbs -36 cu yds -0.15 Rock barbs/mat. transplants -16 cu yds -0.05 Cr. fabric/cr fascine/cntainr plants* -14 cu yds -0.04 Coir fabric/willow poles -39 cu yds -0.02
Treatment Reach Volumetric Changes Gaining TreatmentsOverall volumevol/area Douglas fir revetments/willow stakes* + 98 cu yds +0.53 Juniper revets/willow stakes* + 67 cu yds +0.15 Coir fabric and willow poles + 53 cu yds +0.14 Cr. fabric/rock barbs/rock toe/contner plants + 23cu yds +0.05 Cr. Fabric/willow-dogwood fascine/container plants* + 13 cu yds +0.04 Root wads/mat. transplants/container plants* + 26 cu yds +0.03 Container plantings* + 3 cu yds +0.02
Revetment treatment Downstream end of treatment (-45 cu yds) Upstream end of treatment (+72 cu yds)
Some Conclusions There was little lateral erosion attributed to ice events in either 1997 or 1998. Majority of erosion is attributed to peak flow events. Peak flow in 1997 caused signifcantly more erosion than 1998. As expected, all treatments where vegetation was planted on the terrace away from the immediate bank (as in container plantings alone) and the bank was not adjusted (e.g. sloped), the bank continued to erode. Each cross section of bank is affected by varying factors that contribute to its rate of erosion. Therefore, it may not be appropriate to directly compare control areas to treatment areas. However, it may be more appropriate to compare treatment banks to the same bank at pretreatment levels of erosion.