Download
1 / 21
210 likes | 541 Views
Estimating Abundance: Sightability Models. Visibility Bias. Virtually all counts from the air or ground are undercounts because can’t see all the animals due to vegetation cover or topographic irregularity

E N D
Visibility Bias • Virtually all counts from the air or ground are undercounts because can’t see all the animals due to vegetation cover or topographic irregularity • Solutions utilize mark-resight methods, distance estimation (line transects), a correction factor or a sightability model
Sightability Model • Attempts to remove visibility bias by estimating a correction factor for each group of animals seen. • Adaptable to a variety of conditions. • Cost efficient, especially once model built • Only works if model is applicable and if visibility averages at least 33%.
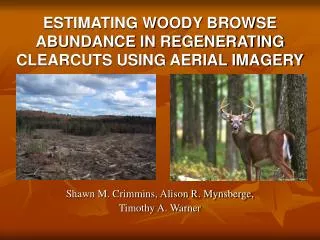
Developing a Sightability (or Visibility Bias) Model • Mark elk (deer, sheep, etc.) groups with radio-collars or have observers on ground keep track of individual groups when helicopter/plane passes over. • Fly aerial survey over the geographic area where the marked groups occur. • Determine which individual groups were seen and which groups were missed.
Developing Sightability Models • Identify which factors such as group size, tree and shrub cover, snow cover, weather, observers, type of helicopter, etc. influenced whether a group was seen or missed. • Important: factors must be ones that will have the same effect each time a survey is conducted
Developing Sightability Models • Keep some factors constant such as type of helicopter or fixed-wing, experience of observers, speed of flight, height above ground, etc. • Estimate the effects of the other important factors we can’t control such as group size, vegetation cover, etc. using logistic regression.
Sightability Model:Analysis • Logistic regression is one of a number of statistical models that can be used to analyze the observations of groups seen and groups missed. • Prob(Seeing group) = em / 1 + em • where m = a + b1 X1 - b2 X2 • e.g. X1 = group size, X2 = veg. cover
Factors Affecting Elk Sightability • Size of group • Percent vegetation cover around group • Percent snow cover • Secondary factors also statistically signif.: • Activity (moving vs. still) • Observer experience • Composition (Bull groups vs. others) • Type of helicopter or fixed-wing
Sightability Model • Use the logistic regression model to calculate a the probability that each group is seen. • Estimate becomes???
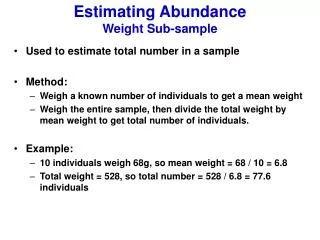
Simple Application • Suppose we see a group of 3 elk in an open forest with 40% cover of obscuring vegetation. • If our logistic regression model estimates that only ½ of groups of 3 in 40% cover are seen (p=0.5), then if we saw this one group of 3 animals, there was probably another group of 3 that we missed.
Simple Application • So if we saw 3 there were actually 6 in the area. • How? Probability of detection = 0.5 • True N = Nobs /Prob. of det. = 3 / 0.5 = 6
Simple Application • If the next group we saw was a group of 2 animals in 80% cover and the model said that we only have a 20% chance of detecting such a group (p=0.2) • We would correct this group of 2 to represent 2/0.2 or 10 animals in the population.
Simple Application • If the next group that we saw was a group of 7 elk standing in an open brushfield with only 15% obscuring cover • The sightability model might predict that such a group would have a 100% chance of being detected (p = 1.0). • What is the estimated true size of the group?
Lochsa River Elk Herd • This sightability model was applied to the elk herd wintering on the Lochsa River in 1985. • Half of the winter range was flown obtaining a raw count of 2718 elk. • When the sightability model corrections were applied to the counts the corrected estimate was 4775 with 90% bound of 458.
Aerial Survey Program • All calculations easily performed • Variety of sightability models • Includes online users manual by Unsworth et al. • Available from Univ of Idaho’s Fish and Wildlife Dept. web site. Go to (http://www.uidaho.edu)