Download
1 / 1
10 likes | 24 Views
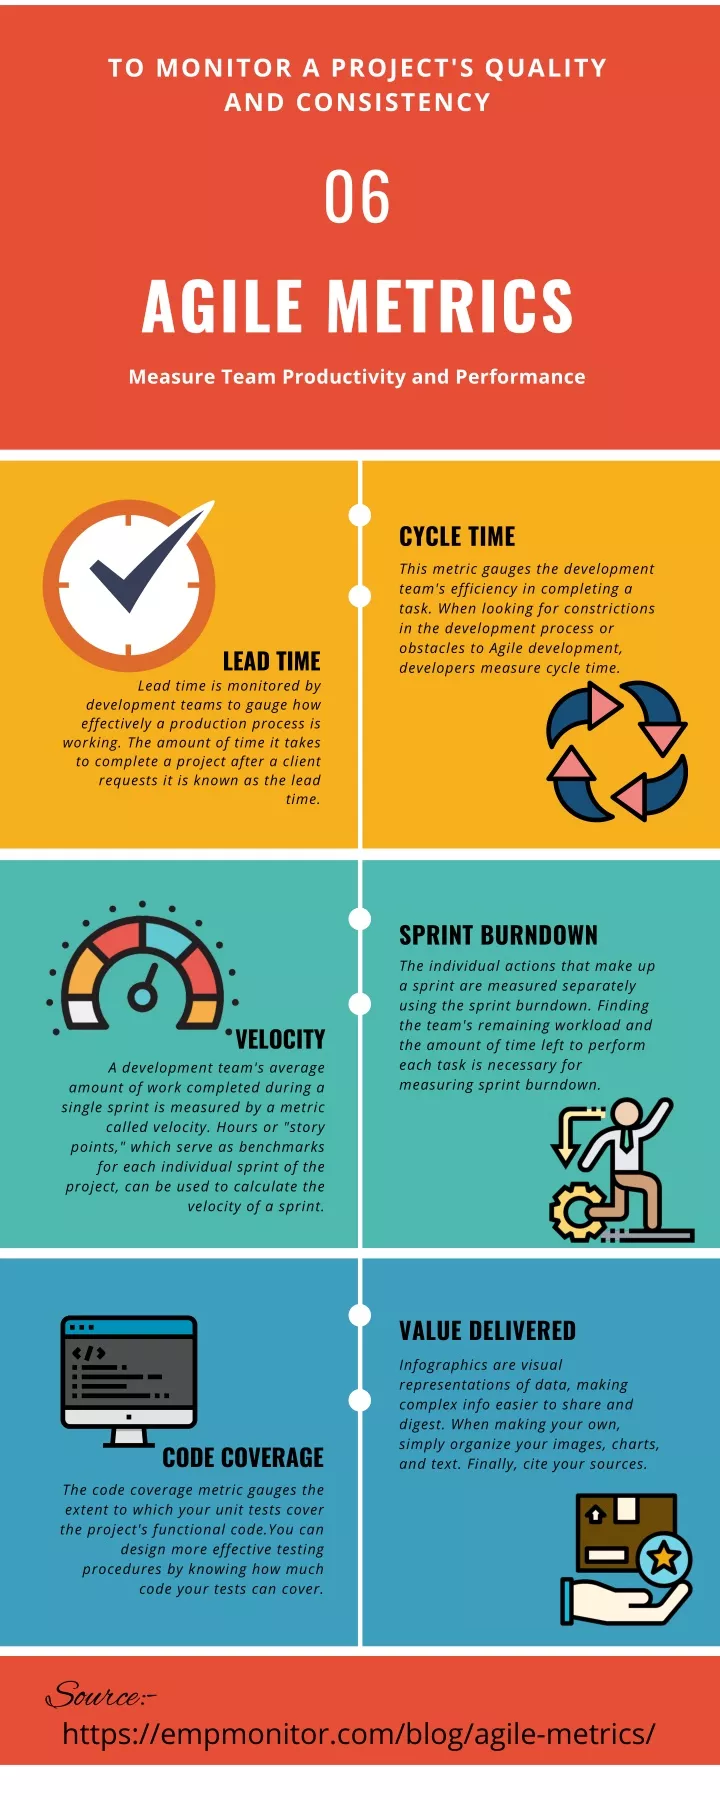
In this Infographic, you will get to know about the Agile metrics which will help you to boost your business. For more details, visit: https://empmonitor.com/blog/agile-metrics/<br>

E N D
TO MONITOR A PROJECT'S QUALITY AND CONSISTENCY 06 AGILE METRICS Measure Team Productivity and Performance CYCLE TIME This metric gauges the development team's efficiency in completing a task. When looking for constrictions in the development process or obstacles to Agile development, developers measure cycle time. LEAD TIME Lead time is monitored by development teams to gauge how effectively a production process is working. The amount of time it takes to complete a project after a client requests it is known as the lead time. SPRINT BURNDOWN The individual actions that make up a sprint are measured separately using the sprint burndown. Finding the team's remaining workload and the amount of time left to perform each task is necessary for measuring sprint burndown. VELOCITY A development team's average amount of work completed during a single sprint is measured by a metric called velocity. Hours or "story points," which serve as benchmarks for each individual sprint of the project, can be used to calculate the velocity of a sprint. VALUE DELIVERED Infographics are visual representations of data, making complex info easier to share and digest. When making your own, simply organize your images, charts, and text. Finally, cite your sources. CODE COVERAGE The code coverage metric gauges the extent to which your unit tests cover the project's functional code.You can design more effective testing procedures by knowing how much code your tests can cover. Source:- https://empmonitor.com/blog/agile-metrics/