Download
1 / 8
120 likes | 303 Views
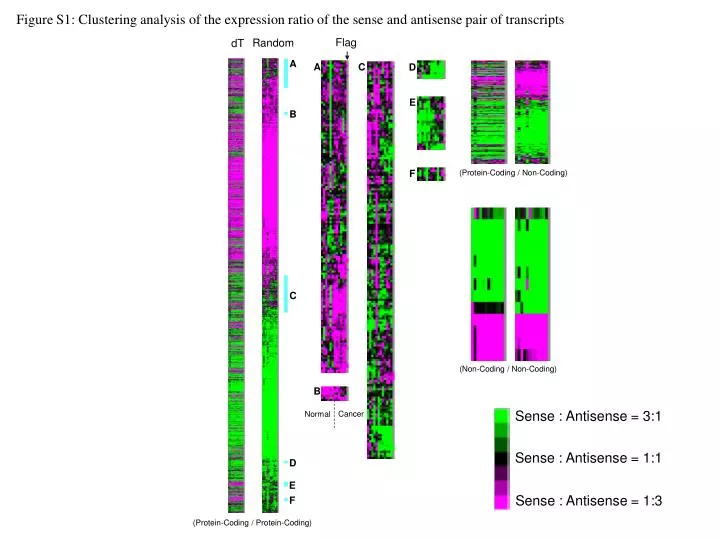
Figure S1: Clustering analysis of the expression ratio of the sense and antisense pair of transcripts. Flag. Random. dT. A. A. C. D. E. B. (Protein-Coding / Non-Coding). F. C. (Non-Coding / Non-Coding). B. Sense : Antisense = 3:1. Cancer. Normal. Sense : Antisense = 1:1. D. E.

E N D
Figure S1: Clustering analysis of the expression ratio of the sense and antisense pair of transcripts Flag Random dT A A C D E B (Protein-Coding / Non-Coding) F C (Non-Coding / Non-Coding) B Sense : Antisense = 3:1 Cancer Normal Sense : Antisense = 1:1 D E Sense : Antisense = 1:3 F (Protein-Coding / Protein-Coding)
Figure S2: Changes in expression for sense-antisense gene pairs in cancer tissues, compared with surrounding normal tissues. (a) Plots of (protein-coding, protein-coding) pairs
Figure S2: Changes in expression for sense-antisense gene pairs in cancer tissues, compared with surrounding normal tissues. (b) Plots of (protein-coding, non-coding) pairs
Figure S2: Changes in expression for sense-antisense gene pairs in cancer tissues, compared with surrounding normal tissues. (c) Plots of (non-coding, non-coding) pairs
Figure S3: Changes in expression for sense-AFAS gene pairs in cancer tissues, compared with surrounding normal tissues.
Figure S4: Clustering analysis of the expression ratio of well-known genes (sense transcripts) and their putative antisense transcripts. Flag dT Random A A C D E B C D B Sense : AFAS = 3:1 Sense : AFAS = 1:1 E Sense : AFAS = 1:3 Normal Cancer
Figure S5: Expression intensities detected by probes designed for the sense gene U69611 and its corresponding AFAS transcript. Expressional intensity of sense gene 500 C N 400 300 200 100 9613299 9547332 Truncated Truncated 100 200 300 C N 400 500 Expressional intensity of AFAS gene
Figure S6: Average Expression levels detected by AFAS probes within every 500 bases with respect to the both termini of sense transcripts. 4000 3500 Normal Cancer 3000 2500 Average Intensity 2000 1500 1000 500 0 -1 -2 -3 -4 -5 5 4 3 2 1 Probe Position 500 bp 500 bp 500 bp 500 bp Sense transcript -1 -2 1 2