Download
1 / 53
530 likes | 636 Views
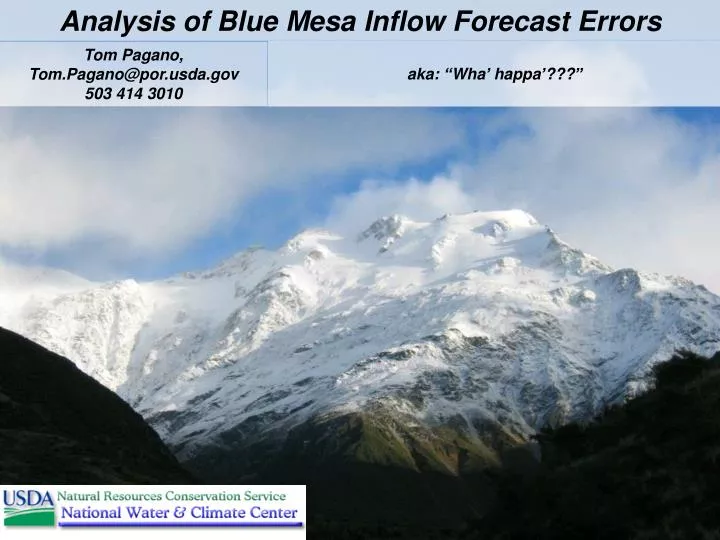
Analysis of Blue Mesa Inflow Forecast Errors. aka: “Wha’ happa’???â€. Tom Pagano, Tom.Pagano@por.usda.gov 503 414 3010. Performance of 2008 forecasts. http://www.wcc.nrcs.usda.gov/wsf/daily_forecasts.html. NRCS daily forecasts. Official coordinated forecasts. Observed.

E N D
Analysis of Blue Mesa Inflow Forecast Errors aka: “Wha’ happa’???” Tom Pagano, Tom.Pagano@por.usda.gov 503 414 3010
Performance of 2008 forecasts
http://www.wcc.nrcs.usda.gov/wsf/daily_forecasts.html NRCS daily forecasts Official coordinated forecasts Observed Daily forecast skill
Official historical published outlooks issued April 1 2008
Forecasts and storage have come up short since 2000 Blue Mesa + Taylor Park Reservoir Storage Full Aug 1 Jan 1 Kac ft
Historical NRCS “End of season” daily forecast skill This takes into account all available data including spring/summer precipitation. Even then, this year still falls out as a big anomaly (major over-forecast) 2008 obs
April-July 2008 Blue Mesa Inflow Forecast Comparison NRCS daily forecasts based on: Precip/Snow obs April-July inflow kac-ft official 1971-00 norm Forecast issue date
April-July 2008 Blue Mesa Inflow Forecast Comparison NRCS daily forecasts based on: Snow only Precip/Snow Precip only obs April-July inflow kac-ft official 1971-00 norm Forecast issue date
April-July 2008 Blue Mesa Inflow Forecast Comparison NRCS daily forecasts based on: Snow only Precip/Snow Precip only NWS ESP obs April-July inflow kac-ft official 1971-00 norm Forecast issue date
NRCS Daily Forecasts for Apr-Jul Blue Mesa Inflow using snow information available by April 11 Forecast too low 2008 snowpack composite well beyond recent historical variability Forecast too high Daily forecast input is a composite of 7 snotel sites: North lost trail, butte, park cone, brumley, independence pass, porphyry creek, slumgullion
2008 Historical range 1981-2007
Park Cone Historical April 1 Snow Data 2008… 2nd biggest in last 42 years 6th biggest in last 72 years Snow water equivalent (in)
End of season snow End of season wyprecip Apr 11 wyprecip Apr 11 snow
What basin processes are important? How have they been behaving recently? (using actual and model data) How is runoff driven by: snow and precipitation soil moisture evaporation/temperature Note: Model is not necessarily reality Sources of predictability 1950-99 VIC model skill (University of Washington) Explained variance in predicting Apr-July runoff Blue – Snowpack Green – Soil Moisture Red – El Nino Darker colors- more important (courtesy of M Dettinger, Scripps)
Snow and precipitation are easily the dominant factor Blue Mesa April-July Inflow Forecast Skill 1979-2007 1.0 = perfect better Real world SNOTEL vs Real world runoff R2 (% var expl) Univ Washington model Snow + Precip NRCS Daily Forecasts worse Model swe + precip versus Model runoff Issue date of forecast Snow/precipitation explain upwards of 90% of the year to year variability in runoff
Precipitation after April 1 is important Gunnison Basin April-June Precipitation 1920-2008 2000-08 avg: 75% norm 1995 206% Percent of 1971-2000 average 2008 72% 2002 30% Data from WESTMAP: http://www.cefa.dri.edu/Westmap/
Spring precipitation, especially the sequencing with snowmelt is also important Rainfall Snowmelt Rainfall mixed with snowmelt “normal” Runoff April July
Spring precipitation, especially the sequencing with snowmelt is also important Rainfall Snowmelt Rainfall mixed with snowmelt “normal” Runoff Rainfall boosting snowmelt Larger volumes Snowmelt and rainfall separate Not enough “momentum” to produce big volumes April July All these complex interactions are tough to “cartoonize”; Simulation models can handle this… but still it’s tough to predict beyond 1-2 weeks.
Spring precipitation, especially the sequencing with snowmelt is also important Rainfall Snowmelt Rainfall mixed with snowmelt “normal” Runoff Rainfall boosting snowmelt Larger volumes Snowmelt and rainfall separate Not enough “momentum” to produce big volumes Even then, however, high heat and no rain can lead to “pouring sunshine” April July All these complex interactions are tough to “cartoonize”; Simulation models can handle this… but still it’s tough to predict beyond 1-2 weeks.
Total: Independ Pass Snowmelt Rainfall Schofield Snowmelt Rainfall (inches) Blue Mesa natural inflow kac-ft/day Runoff 2008 Many fits and starts to snowmelt… Almost no spring rainfall
Total: Independ Pass Snowmelt Rainfall Schofield Snowmelt Rainfall (inches) Blue Mesa natural inflow kac-ft/day Runoff 2008 Good mix of rain and snowmelt 1993 1999
Total: Independ Pass Snowmelt Rainfall Schofield Snowmelt Rainfall (inches) Blue Mesa natural inflow kac-ft/day Runoff 2008 Snowpack poor, but “perfect storm” for runoff efficiency 1999
Soil moisture/Groundwater Are we still feeling the effects of 2002?
Blue Mesa Basin Soil Moisture 2001-2008 (According to the Univ Washington Model- top 2 layers)
Blue Mesa Basin Soil Moisture 2001-2008 (According to the Univ Washington Model- top 2 layers) (According to Park Cone Snotel- ~0-30” depth) Snotel does poorly in frozen soils, so that has been censored Model resembles snotel, but also remember we’re comparing basin average with point measurement
Blue Mesa Basin Soil Moisture 2001-2008 (According to the Univ Washington Model- top 2 layers) (According to Park Cone Snotel- ~0-30” depth) Snotel does poorly in frozen soils, so that has been censored Univ Washington Model “deep” soil moisture layer
Only one Colorado USGS groundwater station in realtime (Pueblo) Gunnison: Period of record 2003-2008 + 1996 Measured 1x/year Colorado Active Well Level Network Crested Butte Taken in Mid-may 8/1996
What influence humans? Does it matter? Blue Mesa For each site, all measurements Jan-Jun, Jul-Dec are averaged by year. Station half-year data then converted into standardized anomaly (o-avg(o))/std(o) vs period of record for the half year. Multiple stations are then averaged.
Univ Washington model Blue Mesa inflow basin total soil moisture (mm) January 1 1920-2008 Start of 2008
Butte SNOTEL sublimation (as modeled by NOHRSC) Oct-Jul Subl Year Precip Prcp 2004 19.3” 30% 2003 19.6” 29% 2005 24.5” 15% 2006 22.7” 16% 2007 18.1” 18% 2008 29.3” 10% Water year to date cumulative sublimation (inches) Long-term average evaporation + transpiration + sublimation = 73% of annual precipitation
Gunnison Basin March-May Average Temperature 1920-2008 Warm spring temps recently except last year Departure from 1971-2000 Data from WESTMAP: http://www.cefa.dri.edu/Westmap/
How good are forecasts in general? “Perfect forecasts are all alike; Every bad forecast is bad in its own way.”
“Published Official” -Subjective (based on objective guidance) -Humans actively involved -Coordinated by NRCS+NWS
http://www.wcc.nrcs.usda.gov/wsf/daily_forecasts.html “NRCS Daily” -Objective -Statistical model-based -Highly automated -Only uses SNOTEL snow+wytd precip
http://www.hydro.washington.edu/forecast/westwide/sflow/index.shtmlhttp://www.hydro.washington.edu/forecast/westwide/sflow/index.shtml University of Washington -Objective -Simulation model-based -Highly automated -Research grade
NWS ESP -Objective -Simulation model-based -Human controlled/vetted (in realtime)
Sources Natural flow: (1968-2008) http://www.usbr.gov/uc/crsp/GetSiteInfo Blue Mesa outflow – Taylor Park change in storage Published official: (1971-2008) ftp://ftp.wcc.nrcs.usda.gov/data/water/forecast/ With gaps filled in from other sources NWS ESP: (1981-2002) http://www.nwrfc.noaa.gov/westernwater/database/index.php?id=BMDC2#forecasts University of Washington: (1971-2008) http://www.hydro.washington.edu/forecast/hepex/esp_cmpr/ NRCS Daily: (1979-2008) http://www.wcc.nrcs.usda.gov/wsf/daily_forecasts.html All reforecasts available internally, some available online
Period common to all datasets Blue Mesa April-July Inflow Forecast Skill 1981-2002 worse RMSE as % 1971-2000 Normal NRCS Daily Published official better 0 = perfect Issue Month of Forecast (e.g. January 1) RMSE = sqrt(avg(f-o)2)
Blue Mesa April-July Inflow Forecast Skill 1981-2002 worse RMSE as % 1971-2000 Normal NRCS Daily Published official better NRCS Daily (residual) 0 = perfect Issue Month of Forecast (e.g. January 1) RMSE = sqrt(avg(f-o)2)
Forecasting runoff from a start date in June… Model Forecast Observed Model Simulated
Forecasting runoff from a start date in June… Is your April-July “forecast” your 1. observed + future only forecast or is it 2. simulated + future only forecast? Forecasting “residuals” (1.) is more accurate but is an “open book” exam Model Forecast Observed Model Simulated
Blue Mesa April-July Inflow Forecast Skill 1981-2002 worse RMSE as % 1971-2000 Normal NRCS Daily Published official better NRCS Daily (residual) 0 = perfect Issue Month of Forecast (e.g. January 1) RMSE = sqrt(avg(f-o)2)
Blue Mesa April-July Inflow Forecast Skill 1981-2002 worse RMSE as % 1971-2000 Normal University of Washington NRCS Daily Published official better NRCS Daily (residual) 0 = perfect Issue Month of Forecast (e.g. January 1) RMSE = sqrt(avg(f-o)2)
Blue Mesa April-July Inflow Forecast Skill 1981-2002 worse RMSE as % 1971-2000 Normal University of Washington NRCS Daily Published official better NRCS Daily (residual) NWS ESP 0 = perfect Issue Month of Forecast (e.g. January 1) RMSE = sqrt(avg(f-o)2)
Blue Mesa April-July Inflow Forecast Skill 1981-2002 100 = perfect NWS ESP NRCS Daily (residual) Published official better NRCS Daily University of Washington R2 (% var expl) worse Issue Month of Forecast (e.g. January 1) What’s different: This does not penalize for bias
Blue Mesa April-July Inflow Forecast Bias 1981-2002 Forecasts too high Forecast Bias as % 1971-2000 Normal University of Washington NRCS Daily Published official NWS ESP Forecasts too low Issue Month of Forecast (e.g. January 1) Bias = avg(f) – avg(o)
Blue Mesa April-July Inflow Forecast Bias 2000-2007 Forecasts too high University of Washington Forecast Bias as % 1971-2000 Normal NRCS Daily Published official NWS ESP (not available) Forecasts too low Issue Month of Forecast (e.g. January 1) Note: 2000-2007 were dry years. Comparatively, the 71-00 normal had a “bias” of +36% (!) Bias = avg(f) – avg(o)
Conclusions From a snow perspective, 2008 was an epic bust. Water year precipitation matched runoff however. Lack of spring precip and sequencing of snowmelt important All existing models have comparable skill. 30% normal error is typical Jan 1, 20-25% error on April 1 Snow, rainfall, evap, soil moisture important to runoff. Some easier to quantify than others. Recommendations Have local/anecdotal observations feed quantitative historical analyses to build appropriate models. Collect the right data to support creation of objective operational guidance, tempered by reason. Recognize the unknowable versus the unknown. Remember too that higher accuracy is not the only way to improve forecasts