Download
1 / 31
310 likes | 454 Views
10. The Case for Free Markets: The Price System. Outline. Efficient Resource Allocation and Pricing Scarcity and the Need to Coordinate Economic Decisions How Perfect Competition Achieves Efficiency. Three Coordination Tasks in the Economy.

E N D
10 The Case for Free Markets: The Price System
Outline • Efficient Resource Allocation and Pricing • Scarcity and the Need to Coordinate Economic Decisions • How Perfect Competition Achieves Efficiency
Three Coordination Tasks in the Economy • Recall: since resources are scarce, society must use them efficiently. • Society must choose: • How much of each good to produce. • What input quantities to use in production. • How to distribute goods to consumers. • Here we examine how 3 tasks are achieved by market system under perfect competition.
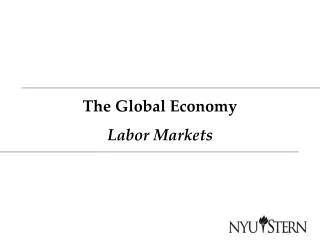
S a n R i c h m o n d – R a f a e l S a n R a f a e l B r i d g e G o l d e n A G a t e B e r k e l e y B r i d g e 1 0 1 O a k l a n d 8 0 S a n F r a n c i s c o – S a n O a k l a n d B a y F r a n c i s c o B r i d g e S a n M a t e o – H a y w a r d B r i d g e 9 2 F r e m o n t D u m b a r t o n B r i d g e 8 4 B P a l o A l t o FIGURE 1.Toll Bridges of the San Francisco Bay Area S a n P a b l o B a y 71 1 7 1 0 1 9 2 8 4
Real World Puzzle • How much should P be to cross the SF-Oakland Bay Bridge? • Bay Bridge is very congested. • Enormous volume of toll-paying traffic has long ago paid the cost of building it. • Yet, economists argue that P Bay Bridge > P San Mateo-Hayward or Dumbarton Bridges –which are less crowded. • Why?
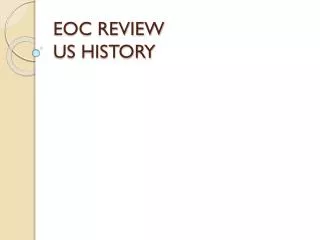
Efficient Resource Allocation and Pricing • Scarcity limits # of goods that can be produced. • PPF used to illustrate concept of scarcity. • Recall: PPF (in Fig. 2) shows all combos of missiles and milk that an economy can produce given available resources and technology. • Pt D –if 300 missiles are produced, then economy has enough resources left to produce 500b milk. • Pt G is inefficient –could produce 200b more milk without giving up any missiles.
Efficient Resource Allocation and Pricing • Points below PPF → resources are wasted • Efficient allocation of resources: it is impossible to make some people better off without making others worse off. • Pt G –can move to E and produce more of both goods with available S of inputs. So it’s possible to make some people better off without harming anyone. • All points below PPF are inefficient. • All points on PPF are efficient → cannot get more of 1 good without giving up some of other.
B D E G F C FIGURE 2.PPF and Efficiency 700 600 500 400 300 Quarts of Milk Billions of 200 100 0 100 200 300 400 500 Missiles
Pricing to Promote Efficiency: An Example • Use puzzle to see how P can guide efficient choices. • Higher tolls for Bay Bridge can ↓commute time → ↑efficiency. • 3 routes from Berkeley to Palo Alto: • Richmond-San Rafael Bridge, cross Golden Gate Bridge, through SF and south on HWY 101 • Bay Bridge and south on HWY 101 • San Mateo-Hayward Bridge or Dumbarton • Which route uses resources (commuter time and gas) most efficiently?
Pricing to Promote Efficiency: An Example • ↑ efficiency if a driver who is indifferent between routes would pick least crowded bridges → ↓travel time for everyone. • Routes 1 and 2 are not socially desirable because of added delays for everyone. • Route 3 is best from public interest. Key: Helps if ↑P to cross most crowded bridges and ↓P to cross less crowded bridges. Then more drivers use less crowded bridges.
Can Price Increases Ever Serve the Public Interest? • Price increases can be useful when they lead people to economize on use of scarce goods and resources. • Low prices do NOT always serve the public interest. • E.g., if P crossing a crowded bridge is too low → drivers crowd bridge even more. Or if P gas is too low → drivers do not conserve gas and further damage the climate/environment.
Can Price Increases Ever Serve the Public Interest? • 10 yrs before great potato famine, Economics Professor Longfield (at University of Dublin) stated: • “Suppose the crop of potatoes in Ireland was to fall short in some year –say, 1/6th of the usual consumption. If there were no increase in price, the whole supply of the year would be exhausted in 10 months, and for the remaining two months, a scene of misery and famine beyond description would ensue. But when prices increase, the sufferers often believe that it is not caused by scarcity. They suppose that there are provisions enough, but that the distress is caused by the insatiable greed of the possessors and they have generally succeeded in obtaining laws against price increases, which alone can prevent provisions from being entirely consumed long before a new supply can be obtained.”
Can Price Increases Ever Serve the Public Interest? • If potato crop fails → potatoes are scarce → consumers need to use resources efficiently –stretching out current C until next crop arrives. • Society must ↓C which happens automatically if ↑P. • Yet, if P potato is too low → consumers will use resources inefficiently, resulting in hunger. • Higher prices can serve the public interest better than lower ones. • E.g., Rent controls reduce housing quality and availability in NY City.
The Need to Coordinate Economic Decisions • Entire economy is very complex with millions of different decision makers. • I may buy a pint of Chunky Monkey today; along with 1,000s of other consumers all over U.S. But I don’t know or care about their purchasing decisions. • Yet, scarcity requires that these individual demands be coordinated with production, so that Qd = Qs. • Massive coordination task involving: consumers, supermarkets, wholesalers, shippers, and dairy farmers. All of whom must somehow agree on their decisions.
The Need to Coordinate Economic Decisions • Planned economy: producers are told how much to produce and consumers are told what to purchase. • Market economy: prices coordinate economic activity. • High P→ discourage C of scarce resources and encourage more production. • Low P → encourage C of abundant resources and discourage further production.
Three Coordination Tasks: Mix of Output • Output selection is solved by forces of S and D. • Shortage: ↑P → more production and less consumption • Surplus: ↓P → more consumption and less production • If ↑D ice cream → Qd > Qs (temporary shortage) → ↑P ice cream → ↑production ice cream. • How does production rise? • Initially milk that would have been used to make cheese or sour cream is used to make ice cream instead. • If high P ice cream persists, then dairy farmers begin buying more cows, more dairy milking equipment, etc.
Three Coordination Tasks: Mix of Output • ∆D shifts the allocation of resources. • If more ice cream is wanted, then more resources are devoted to ice cream production. • No government official or planner determines resource allocation. • Lure of profits and signal of prices guides dairy farmers to raise their output when ice cream is in greater demand.
Three Coordination Tasks: Efficient Usage of Inputs • Usage of inputs: inputs are assigned to firms that can make the most profitable use of them. • Firms that cannot make sufficiently productive use of an input will be priced out of the market for that input. • E.g., if ↑D cars → ↑P cars → ↑D steel → ↑P steel → ↓steel use by appliance manufactures who cannot use the steel as profitably as the carmakers. • Input prices signal the appropriate usage of inputs in production.
Three Coordination Tasks: Efficient Usage of Inputs • Example where input prices are not allowed to provide proper signals to producers: • 2 ways to ↑egg production: (1) ↑ feed , or (2) ↑ heat from blowers powered by natural gas. • Steel mills also use natural gas in production and there are no economical substitutes. So a mill would have to seriously ↓prod if natural gas is unavailable. • Vs. egg farmers could switch from natural gas to feed for a few pennies more.
Three Coordination Tasks: Efficient Usage of Inputs • When P natural gas was capped in 1970’s, egg farmers consumed large and socially inefficient Q of natural gas. When P ceiling was lifted, farmers went back to using more feed. • How would a central planner know to allocate more natural gas to steel mills and less to egg farmers? • Free markets allow input prices to signal the appropriate (most efficient) usage of inputs in production.
Three Coordination Tasks: Distribution to Consumers • Distribution of goods among consumers: consumers purchase what they like best given their income. • Previous example: ↑P ice cream → consumers who are lukewarm about ice cream ↓Qd. So ↑P rations available ice cream among consumers who are willing to pay the most for it. • Rationing by P is better than distribution under central planning where every consumer would get 2 pints per week –even if someone hates it.
Three Coordination Tasks: Distribution to Consumers • Rationing by P does favor the wealthy because they can afford more. However, concerns about poverty doesn’t mean we should eliminate P system. • Tax wealthy and give to poor and continue to let P system allocate goods to those who value them most.
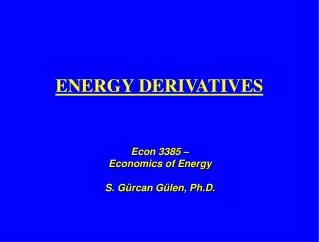
Which Buyers and Which Sellers Get Priority? • The price mechanism ensures that: • Consumers who want a scarce commodity most will receive it. • Sellers who can produce it most efficiently will get to supply the commodity. • In Fig. 3, DG –6,000 customers with different preferences. Pt A 1,000 customers willing to pay $70; pt B next 1,000 are only willing to pay $60, etc. • In equilibrium: P = $40 and buyers at pt A, B, C, and E will buy the book. But consumers at F and G won’t. • Book goes to consumers who value it most.
D S A a B b C c E e f F g G S D FIGURE 3.Price Excludes Buyers and Sellers Who Care Least Best-selling book Demand curve, DD, reflects consumers’ marginal utilities. LR Supply curve, SS, reflects firm’s LR average costs. $70 60 50 Price 40 30 20 10 0 1 2 3 4 5 6 7 8 Quantity in thousands
Which Buyers and Which Sellers Get Priority? • SS is LR industry S curve. • Pt g: Qs by firms whose AC < $20 and pt f is Qs by firms whose AC < $30, etc. • As we move up the S curve, increasingly inefficient firms are included among suppliers. • In equilibrium: P = $40 and only those suppliers with AC < $40 (pts g, f, and e) get to sell the good. But less efficient suppliers (like pts c and b) won’t.
How Perfect Competition Achieves Efficient Output Selection • Efficient production of any good requires MU = MC. • This max difference between TU and TC to society of producing the quantities chosen. • E.g., MU beef = $8 and MC = $5 → cost of producing 1 more lb is less than consumers are willing to pay for it, so ↑Q beef by 1 lb would ↑ welfare. • Or if MU = $3 and MC = $5 → cost of producing 1 more lb is greater than consumers are willing to pay for it, so ↓Q beef by 1 lb would ↑ welfare. • Producing Q beef where MU = MC ensures society allocates correct amount of resources to beef production.
How Perfect Competition Achieves Efficient Output Selection • Recall, under perfect competition MU = MC. • Firms max profit by selecting Q where P = MC. • Consumers max CS by selecting Q where P = MU. • Without any central planning or government interference, perfect competition ensures that correct amount of resources are allocated to produce goods so that society’s welfare is maximized.
Fairness versus Efficiency • Economists often offer efficient solutions that are deemed inequitable. • E.g., economist favor “peak-load” pricing to encourage less use of public transportation during rush hours. A train seat is more scarce during rush hour. So efficiency demands that seats be more expensive during peak usage to discourage consumers with flexible schedules from using trains during rush hour. • Public thinks it’s unfair to make low-wage workers pay higher train ticket fares.
Resolve Bay Bridge Pricing Puzzle • Efficient bridge use requires higher tolls on more crowded bridges. • Same toll charged for all bridges ($4) even though Bay Bridge is most crowded. • Why does least crowded bridge (Dumbarton) have same toll as most crowded? • Many feel it is fair to have those who travel on a particular bridge pay for its costs. Thus, it would be unfair for those who use the crowded Bay Bridge to pay more.
Resolve Bay Bridge Pricing Puzzle • Economics alone cannot decide the appropriate trade-off between fairness and efficiency. • Economics cannot judge whether a pricing scheme is fair or unfair. • Economics can indicate that a particular pricing decision (sought for its fairness) will impose heavy inefficiency costs on commuters.
Market System Generates Growth • Markets are unsurpassed in their ability to produce goods efficiently but also in their ability to create wealth. • Today, average American can afford 10 times the quantity of goods and services that an individual’s income would have bought 100 years ago. • Ultimately, the failure to achieve growth and create wealth helped to end communism in Eastern Europe and to promote market reforms in China.