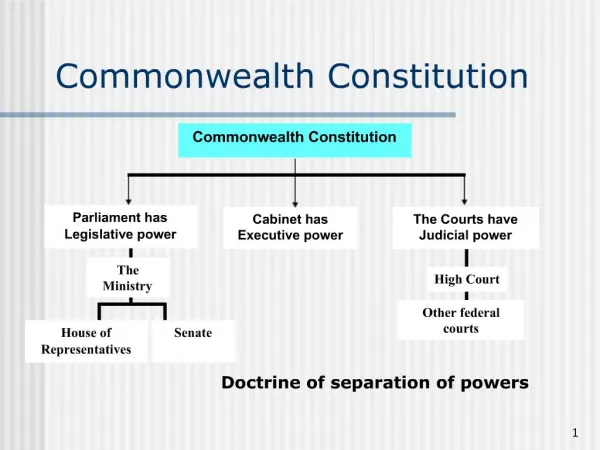
Commonwealth Project
This project aims to analyze the sales figures of our toy car across various Commonwealth nations. The graph will visually represent the varying sales data, highlighting India with the highest sales of 1,257,476 units, followed by Pakistan and Nigeria. The target audience includes children ages 5-10 and adults ages 25-40. We'll include vibrant images from each country to enhance visual appeal and promote engagement. The purpose of the graph is to distinctly showcase sales disparities and attract potential buyers. An enticing layout and catchy title will make our findings resonate with both kids and adults.


Commonwealth Project
E N D
Presentation Transcript
Product Sales Commonwealth Project
Brief • Your company has asked you to plan a feature on the sales of your toy car in number of commonwealth countries. They require you to produce a graph that is visually appealing and how the sales figures differ to each other.
Specification • Product and Company name must be included. • Present data clearly. • Distinguish the highest sales figures from the others in you chose group. • Appeal to the target audience: • Children 5- 10 male and female • Adults 25-40 male and female • Include positive images of the countries involved • Include a catchy title • Explain the purpose of the graph • Create a fun layout
Sales Figures • India 1,257,476 • Pakistan 183,936 • Nigeria 177,096 • Bangladesh 154,514 • United Kingdom 64,231 • South Africa 52,982 • Tanzania 45,950 • Kenya 43,291 • Uganda 35,363 • Canada 35,236
Research page 1 • Copy the brief onto your paper. • Analyse the brief and specification • Identify the target market. • Identify any other conditions or constraints. • Select and sketch out the best type of graph or chart or the job. • Research and source images that you could use in your layout.