1 H NMR Spectroscopy
270 likes | 811 Views
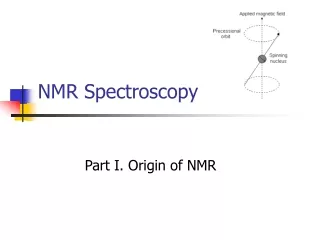
1 H NMR Spectroscopy. A short introduction Larry Scheffler. Introduction. Nuclear magnetic resonance, or NMR involves the study of what occurs when the nuclei of certain atoms are placed in a static magnetic field and exposed to a second changing magnetic field.

1 H NMR Spectroscopy
E N D
Presentation Transcript
1H NMR Spectroscopy A short introduction Larry Scheffler
Introduction • Nuclear magnetic resonance, or NMR involves the study of what occurs when the nuclei of certain atoms are placed in a static magnetic field and exposed to a second changing magnetic field. • Molecules that contain hydrogen atoms. produce an NMR signal. • The nature and pattern of that signal depend on the immediate environment of the hydrogen atoms. • Since organic molecules contain large numbers of hydrogen atoms the study of the NMR spectra is a useful tool in identifying a particular compound.
Information from NMR • There are three basic kinds of information that can be derived from NMR spectra that are useful in identifying organic compounds. These include The signal strength The splitting pattern The chemical shift
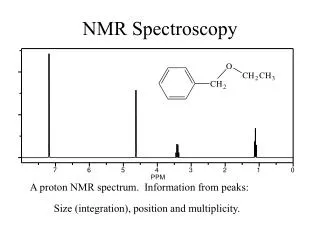
Parts of an NMR spectra The NMR spectra for ethyl ethanoate appears above In the molecule there are hydrogen atoms in three different environments resulting in three different signals (Labeled A, B, and C respectively)
The chemical shift The chemical shifts for the three peaks are shown at the bottom of the spectrum. The degree to which a signal is shifted depends on the environment of the hydrogen atoms
The Splitting pattern Notice that the signal for the protons designated A is split into 4 peaks. The number of peaks is one more than the number of adjacent carbon atoms
The Splitting pattern Since there are three hydrogens on the adjacent carbon atom (C)that is adjacent to A there are four peaks
The Splitting pattern Likewise C is split into three peaks since there are two hydrogens on the adjacent carbon atom A.
The Splitting pattern B is not split since there are no hydrogens on its adjacent carbon atom
Area Under the Curve The black numbers in the spectrum indicate the signal strength. They are proportional to the area of the signal and the relative numbers of hydrogen atoms responsible for the signal.
Additional NMR Spectra 4-methylbenzaldehyde or 4 methyl benzenal
Additional NMR Spectra 4 isopropyl-1-methoxybenzene