Download
1 / 25
250 likes | 331 Views
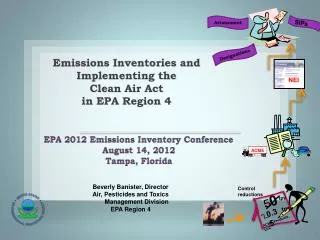
Emissions in the WRAP Region. Four Corners Air Quality Task Force: Cumulative Effects Work Group Call May 1, 2006 Tom Moore 970-491-8837 or mooret@cira.colostate.edu. Presentation Objectives. Results for emissions data collection and analysis to date Workshop series for more information:

E N D
Emissions in the WRAP Region Four Corners Air Quality Task Force: Cumulative Effects Work Group Call May 1, 2006 Tom Moore 970-491-8837 or mooret@cira.colostate.edu
Presentation Objectives • Results for emissions data collection and analysis to date • Workshop series for more information: • January 10-11: Reasonable Progress/SOx/NOx Workshop: http://wrapair.org/cal/calendar.php?op=view&id=458 • May 23-24: Fire, Carbon, & Dust Workshop: http://wrapair.org/cal/calendar.php?op=view&id=505 • Additional workshops in 2006-07
Issues to Consider Emissions • What and where are the contributing emissions? • Natural vs. anthropogenic • Controllable vs. uncontrollable • What and where are the changes in emissions by source category: 2002 to 2018? • What have we achieved in terms of completeness and representativeness of the emissions inventories? • How are we doing on tribal emissions inventories? • What are the limitations/problems/remaining challenges with the emissions? • What and where are the problems?
Scope of regional technical effort • Analyze significant regional components of haze • Large, regionally ubiquitous sources and impacts • Provide consistent, comparable, and reproducible regional analyses • Interstate consultation regarding the emissions contributions of states and tribes to each Class I area • Assessment of the visibility improvement from adopted and proposed control strategies at each Class I area within and downwind of the WRAP region
Scope of regional technical effort, cont. • Status to date • Completed Geographic Source Attribution project • Completed 2000-04 baseline monitoring • Completed review and QA of state and tribally-reported 2002 emissions data for all source categories • Completed 2018 base case emissions data – projection methods for WRAP region have received broad review • Developing Technical Support System to store, access, use, and display data • Plan for next year • Modeling simulations to assess control strategies • Combined analyses of emissions, monitoring, and modeling data to provide “Weight of Evidence” results for each Class I area • Document findings
Progress on Emissions Inventories • There are standard methods for some source categories – WRAP has improved/QAed • Point, area, on- and off-road mobile, biogenics • First regional EI for oil and gas production and distribution • Area sources are generally poorly resolved • Inventory methods have been developed by WRAP for some categories. Have received broad review and application • Fire • Ammonia • Windblown dust • Commercial marine and off-shore shipping • More than 25 tribes now have EIs
- Tribes with EI data prepared and released as of December 6, 2005
Dust, Ammonia, Biogenics • Dust emissions breakdown • Windblown assumed constant into future • Projected growth and control for road dust, agricultural, construction, stationary sources • Comprehensive ammonia inventory • “Fugitive” ammonia emissions estimated for first time • All categories poorly resolved, to be held constant 2002 to 2018 • Biogenics – natural emissions from plant life – held constant
WRAP-up: Emissions Results What do we know? • Emissions inventories completed for: • 2002 Actual Emissions • 2000-04 Baseline Period for Fire and CAMD EGUs • 2018 Base Case (rules on the books, growth and control) • 2002 to 2018 changes estimated • Change for point and area sources varies up and down by state • Mobile down noticeably, commercial marine shipping is exception • Fire scenario forecasts developed, variable by year and location • Dust and other sources generally held constant, unless change in future estimates can be supported • Oil and gas emissions data – first try, will continue to improve • Tribal data becoming more complete • Complete and comprehensive emissions data available
WRAP Air Quality Modeling Regions High resolution 12 km nested grid for the WRAP region Coarser 36 km North American grid