Download
1 / 54
540 likes | 599 Views
Learn about the critical role of inventory management in healthcare, how it impacts budgets, operations, and customer satisfaction. Explore various inventory classification methods and control objectives to optimize efficiency and cost-effectiveness.

E N D
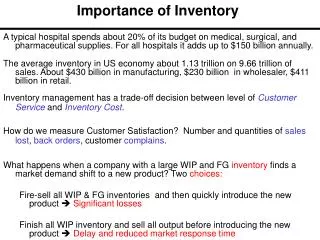
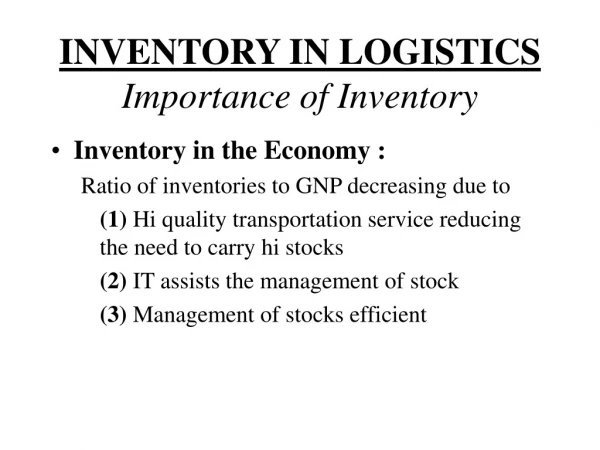
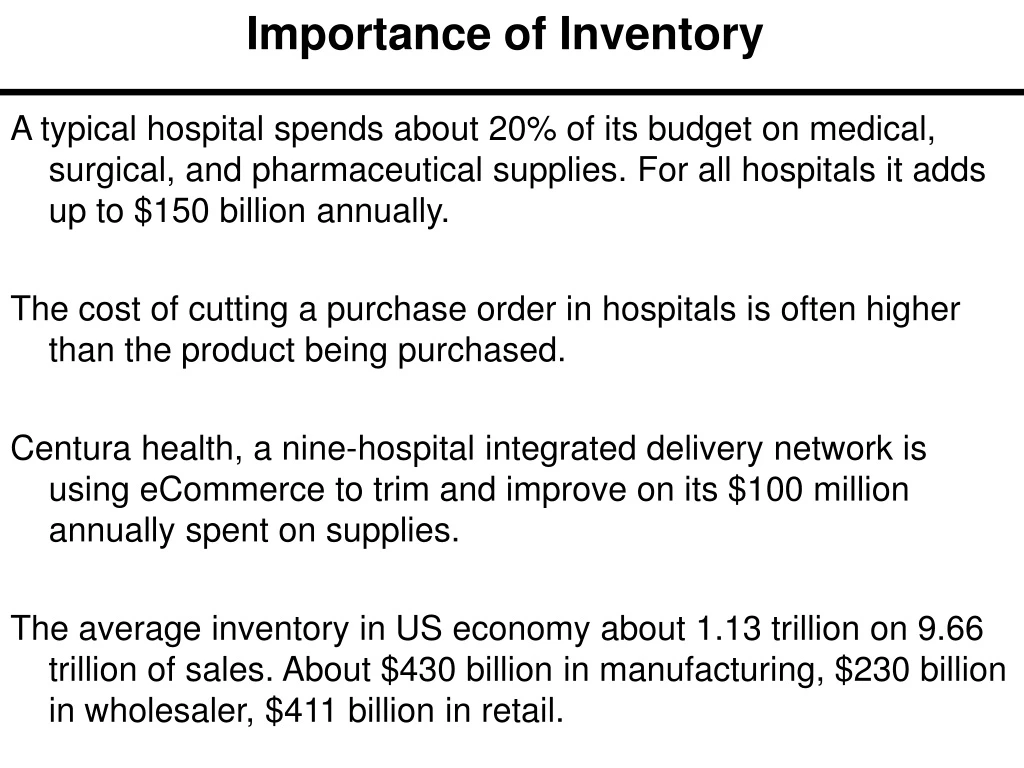
Importance of Inventory A typical hospital spends about 20% of its budget on medical, surgical, and pharmaceutical supplies. For all hospitals it adds up to $150 billion annually. The cost of cutting a purchase order in hospitals is often higher than the product being purchased. Centura health, a nine-hospital integrated delivery network is using eCommerce to trim and improve on its $100 million annually spent on supplies. The average inventory in US economy about 1.13 trillion on 9.66 trillion of sales. About $430 billion in manufacturing, $230 billion in wholesaler, $411 billion in retail.
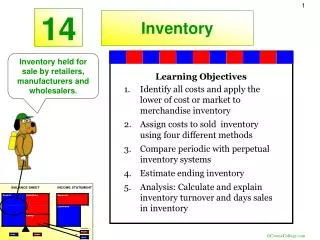
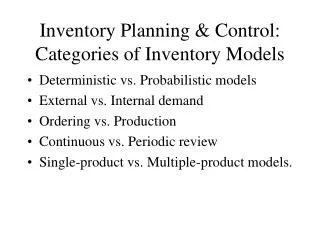
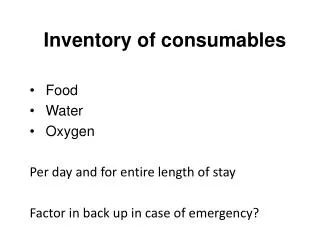
Inventory Classified Inputs Inventory • Flow units that are waiting to begin process • Raw materials In-process inventory • Flow units that are being processed • Transformation of goods and materials Outputs Inventory • Processed flow units that have not yet exited the system • Finished Product In Transit Inventory • Flow units that are in transit to a final destination
Inventory Classified Further To meet anticipated customer demand (anticipated inventory and safety stock). To smooth production while meeting seasonal demand (seasonal inventory). To take advantage of Economic Order (or Economic Production) Quantities (cycle inventory). To decouple operations (line balancing inventory). To permit operations due to production and delivery lead times (pipeline inventory).
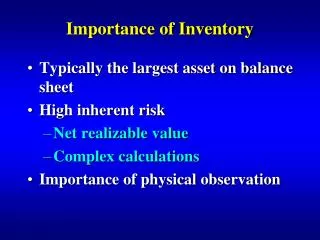
Inventory Operations, finance, and marketing have interest in inventories. Poor inventory management hampers operations, diminishes customer satisfaction, and increases operating costs. A typical firm probably has tied in inventories about 30 percent of its current assets 90 percent of its working capital Both Understocking and Overstocking are undesirable; Understocking; lost sales, dissatisfied customers, production lost. Overstocking; tied up funds, physical holding cost, obsolescence.
Objectives of Inventory Control Inventory management has a trade-off decision between level of Customer Service and Inventory Cost. How do we measure Customer Satisfaction? Number and quantities of sales lost, back orders, customer complains. How do we measure Inventory Costs? • Inventory turnover (the ratio of the annual cost of goods sold to average investment in inventories), • Days of inventory on hand (days of sales that can be supplied from existing inventories).
Periodic Inventory (Counting) Systems Physical count of items made at periodic intervals. Disadvantage: no information on inventory between two counts. Advantage: order for several items are made at the same time. At each count, the inventory level is identified and the required volume to satisfy the demand during the period (until the next count) is ordered. The quantity of order is variable but the timing of order is fixed. Re-Order Point is defined in terms of time.
Periodic Review Systems Inventory on Hand Review period RP RP Target inventory level, TIL First order quantity, Q1 Q3 Q2 d3 d1 Amount used during first lead time d2 Safety stock, SS First lead time, LT1 LT2 LT3 Time Order 3 placed Order 2 placed Order 1 placed Shipment 3 received Shipment 1 received Shipment 2 received
Perpetual Inventory Systems Keeps track of removals from inventory continuously, thus monitoring current levels of each item. A point-of-sales (POS) system may record items at the time of sale. When inventory reaches Re-Order Point (ROP) an order of EOQ (Economic Order Quantity) units is places. The quantity of order is fixed but the timing of order is variable. Re-Order Point is defined in terms of quantity.
Perpetual Review Systems Inventory on Hand Review period RP RP Target inventory level, TIL First order quantity, Q1 Q3 Q2 d3 d1 Amount used during first lead time d2 Safety stock, SS First lead time, LT1 LT2 LT3 Time Order 3 placed Order 2 placed Order 1 placed Shipment 3 received Shipment 1 received Shipment 2 received
Bin Systems Order One Bin of Inventory Order Enough to Refill Bin Two-Bin System (Perpetual) Empty Full One-Bin System (Periodic)
High A Annual $ volume of items B C Low Few Many Number of Items A classification Approach: ABC Analysis Items held in inventory are not of equal importance in terms of dollar invested, profit potential, sales or usage volume, and stockout penalties. Classifying inventory according to a measure of importance and allocate control efforts accordingly. A-very important B- mod. important C- least important
ABC Analysis; Example Cycle Counting, Accuracy in counting, Customer satisfaction
Economics of Scale Economies of Scale: when average unit cost of output decreases with volume. Such as large quantity discounts (Economies from price discounts), or a total fixed cost which is independent from volume (Economies from fixed cost of procurement) • Fixed order cost of purchasing or fixed setup cost of production does not depend on the volume, the larger the volume the smaller the cost per unit. • EoS of Procurement, EoS of Production, EoS of Transportation. • We often refer to the order or production in response to the economies of scale as batch; production batch, procurement batch, transfer batch.
Inventory Costs What happens when a company with a large WIP and FG inventory finds a market demand shift to a new product? Two choices: Fire-sell all WIP & FG inventories and then quickly introduce the new product Significant losses Finish all WIP inventory and sell all output before introducing the new product Delay and reduced market response time Physical holding costs; warehouse rent, insurance, security, lighting, heating, cooling, spoilage, obsolescence Opportunity cost of capital tied up in inventory; The foregone return on the funds invested in inventory which could have been invested in alternative projects. Physical holding costs per unit of time (typically a year) is expressed as a fraction h of the variable cost of C of acquiring (or producing) one flow unit of inventory. Physical holding cost = hC Opportunity cost of inventory is rC, where r is firm’s rate of return Cumulative cost of holding one flow unit of inventory is therefore H= Physical Holding Cost + Opportunity Cost = (h+r)C
C. Inventory Costs Holding or Carrying Costs: Cost to carry an item in inventory for one year Ordering Costs: Costs of ordering and receiving inventory Shortage Cost: Costs resulting when demand exceeds supply of inventory; often unrealized profit
Basic Inventory Model Assumptions - Only one product - Annual demand is known - Demand is constant throughout the year - Each order is received in a single delivery - Lead time does not vary - No quantity discount
Costs in the Basic Inventory Model Assumptions There are two costs 1-Order Cost 2-Inventory Carrying Cost Unit cost of product is not incorporated because we assume it is fixed. If there is quantity discount, then we need unit cost of product. If inventory carrying cost is stated in terms of a percentage of the unit cost of the product, then we need unit cost of product.
Ordering Policy The optimal order quantity reflects a trade-off between carrying cost and order cost. As order size increases, the order cost decreases, while carrying cost increases. Obviously, the reverse is true for decrease in the order size. When the quantity on hand is just sufficient to satisfy demand in lead time, an order for EOQ is placed. Since there is no variation neither in usage rate nor in lead time, the order will be received at the instant that the inventory on hand falls to zero.
The Basic Inventory Model • Annual demand for a product is 9600 • R = 9600 • Annual carrying cost per unit of product is 16$ • H = 16 • Ordering cost per order is 75 • S = 75 • How much should we order each time to minimize our total cost • How many times should we order • What is the length of an order cycle (working days 288/year) • What is the total cost • Do NOT worry if you do not get integer numbers
Discussion Discuss with the students
The Inventory Cycle Usage rate Profile of Inventory Level Over Time Q Usage rate Quantity on hand Reorder point Time Time Receive order Place order Place order Receive order Receive order Lead time
The Inventory Cycle Profile of Inventory Level Over Time Q Usage rate Quantity on hand Reorder point Time Place order Place order Receive order Receive order Receive order Lead time
The Inventory Cycle Profile of Inventory Level Over Time Q Usage rate Quantity on hand Reorder point Time Place order Place order Receive order Receive order Receive order Lead time
The Inventory Cycle Profile of Inventory Level Over Time Q Usage rate Quantity on hand Reorder point Time Place order Place order Receive order Receive order Receive order Lead time
The Inventory Cycle Profile of Inventory Level Over Time Q Usage rate Quantity on hand Reorder point Time Place order Place order Receive order Receive order Receive order Lead time
Ordering Cost R = Demand in units / year Q = Order quantity in units / order Number of orders / year = S = Order cost / order Annual order cost =
Annual Ordering Cost Annual Cost Ordering Costs Order Quantity (Q)
Carrying cost Q Q/2 0 Q = Order quantity in units / order At the beginning of the period we get Q units. At the end of the period we have 0 units.
Average Inventory / Period Q = Order quantity in units / order At the beginning of the period we get Q units. At the end of the period we have 0 units. Average inventory is = This is average inventory / period. What is average inventory / year Cycle Inventory: The average inventory
Average Inventory / year Time Time
Inventory Carrying Cost Q = Order quantity in units / order Average inventory / year = H = Inventory carrying cost / unit / year Annual carrying cost =
Annual Carrying Cost & Annual Ordering Cost Annual Cost Carrying Costs Order Quantity (Q)
Total Cost Annual carrying cost Annual ordering cost Total cost = + Q R S H TC = + 2 Q
Example Annual demand for a product is 9600 D = 9600 Annual carrying cost per unit of product is 16$ H = 16 Ordering cost per order is 75 S = 75 a) How much should we order each time to minimize our total cost b) How many times should we order c) what is the length of an order cycle (working days 288/year) d) What is the total cost
EOQ 2 RS 2 ( Annual Demand ) ( Order or Setup Cost ) Q = = OPT H Annual Holding Cost Using calculus, we take the derivative of the total cost function with respect to Q and set the derivative (slope) equal to zero and solve for Q.
What is the Optimal Order Quantity R = 9600, H = 16, S = 75
How many times should we order Annual demand for a product is 9600 R = 9600 Economic Order Quantity is 300 EOQ = 300 Each time we order EOQ How many times should we order ? R/EOQ 9600/300 = 32
what is the length of an order cycle working days = 288/year 9600 is required for 288 days 300 is enough for how many days? (300/9600)(288) = 9 days
What is the Optimal Total Cost The total cost of any policy is computed as The economic order quantity is 300 This is the total cost of the optimal policy
Other EOQ Examples Joe Smith needs to drive 2 miles to the closest ATM. He withdraws money weekly. Ordering cost? Driving time and cost. This periodic withdrawal leaves a cycle inventory of money for Joe. Charring cost? The interest on the average cash he has. Big Blue Runs a Bus service. Running the bus on a specific route has fixed costs. Batch Size = The people who arrive between 2 consecutive trips. Inventory cycle = Average number of people waiting to board the bus. The City of Pittsburg collects trash from its residents every week on Monday. The average inventory of trash in the household constitutes that house’s cycle inventory.
Centura Health Hospital A Centura health hospital processes a demand of 600 units of IV starter kit each week and places an order of 6000 units at a time. What is the ordering cycle time? 6000/600 =10 week How many orders per year 52/10 = 5.2 Or R = 600×52 = 31200 units per year 31200/6000 = 5.2 What is cycle inventory 6000/2 = 3000 How long a typical IV unit stays in inventory RT = I 600T = 3000 T = 5 weeks 31200T=3000 T = .096 year
Centura Health Hospital: Traditional Order Size A Centura health hospital incurs a cost of $130 regardless the quantity purchased each time it places an order. S = $130. Cost of each unit is C = $3, and R = 600/week, or 31200/year assuming 52 weeks per year. Inventory carrying cost is $0.9 per unit per year H = $0.90, Q = 6000 Total annual fixed order cost = S(R/Q) = 130(31200/6000) = $676 Total annual holding cost = H(Q/2) = 0.90(6000/2) = $2700 Total annual purchasing cost = CR = 3(31200) = $93600 Total annual cost = TC = S(R/Q) + H(Q/2) + CR = 676 + 2700 + 93600 = $96976
Centura Health Hospital: EOQ Compute Cycle Inventory Icycle = EOQ/2 = 1501 unit Compute Total Cost TC = 130(31200/3002) + 0.9(3002/2) + 3(31200) TC = 96302 Compute Average Flow Time Ti = Icycle/R = 1501/600 = 2.5 weeks
Managerial Insight How Managers Could Reduce EOQ
Insight: How Managers Could Reduce EOQ Fixed Order Cost Reduction: In order to decrease the optimal order size we only have two ways: • Reduce S • Centralize Current Situation • Batches of 3,002 Starter Kits • Cycle inventory of 1,501 • Adds 2.5 weeks to flow time of IV Starter Kits New Situation: reduce cycle inventory by half • Reduce order size by 1,501 • Changes flow time to 1.25 weeks • Infer that optimal size of 1,501 must reduce S to $32.50 from $130
Fixed Order Cost Reduction Applies to fixed costs in: • Procurement • Transportation • Production Includes administrative costs of: • Purchase order • Activities of receiving order Three ways to reduce fixed costs • Technology used to reduce costs • eCommerce; electronic purchase orders • Transportation reduced costs • Changing the transportation mode, ex. Ship to large truck, truck to air • Setup costs reduced • A major factor in lean operations, JIT systems
Inventory vs. Sales Growth Optimal batch is proportionate to the square root of outflow rate. Doubling company’s annual sales does not require a doubling of cycle inventories, i.e., inventory growth should not track sales growth Quadruples outflow rate doubles EOQ Doubles average inventory rate and avg. flow time With increase in company’s annual sales , EOQ increases, however, we need to order more frequently
Centralization and Economies of Scale • Centura Hospital • Nine hospitals order supplies independently • Alternatives • Centralize purchasing of all supplies • Store supplies in central warehouse • Must order for total output flow rate 9 times the output flow rate of each hospital • Average inventory only three times (equal to sq. rt. of 9) that of decentralized warehouse