Download
1 / 48
510 likes | 796 Views
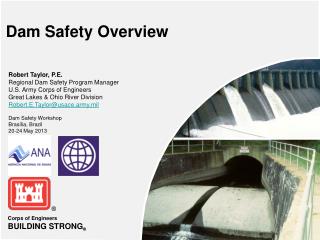
William Empson, PE, PMP Senior Levee Safety Program Risk Manager U.S. Army Corps of Engineers Risk Management Center William.B.Empson@usace.army.mil Dam Safety Workshop Brasília, Brazil 20-24 May 2013. Dam Safety Data Management. Data Management You have the data – what next?

E N D
William Empson, PE, PMP Senior Levee Safety Program Risk Manager U.S. Army Corps of Engineers Risk Management Center William.B.Empson@usace.army.mil Dam Safety Workshop Brasília, Brazil 20-24 May 2013 Dam Safety Data Management
Data Management You have the data – what next? Amanda Sutter, P.E. CEMVS
Purpose Perform timely evaluation of data to assure that unsafe performance of a structure is detected as early as possible.
Objectives • Learn various methods of data collection, processing, presentation, evaluation and reporting requirements • Identify various factors that influence dam safety instrumentation data.
Components of Data • Management • Collection • Reduction and processing • Presentation • Evaluation
Data Collection Schedule Factors affecting schedule Purpose of the instrument Project conditions Age of project Loading event Observed anomaly Availability of personnel Project location Funding Corporate policy Funds New Leak Flood
Data Collection Data set should contain Project Instrument ID Instrument reading Readout unit Reader’s name Date Pool and Tail Weather conditions Unusual conditions Instrument damage
Data Collection Consistency Personnel Manner readings are taken Equipment Label instruments Train data collection personnel Multiple readings Coordination of instrument readings
Data Collection Data Entry Data books Field sheet Laptop computer Handheld or pocket computer
Data Collection Equipment used to monitor instruments should be calibrated and in good operating condition. Good communication is critical between person(s) reading instruments and office personnel Threshold values should be established and furnished to person(s) collecting and transmitting data.
Reduction and Processing Data Reduction Software Corps Instrumentation Database Package, WinIDP Software developed in district Commercial software Microsoft Excel or Access SINCO GeoKon Geomation
WinIDP • Development • HQUSACE proponent • Based on survey of Districts (1990) • Dam safety instrumentation needs • Compatibility with existing databases • Converted to windows 1996 • Web portal and GIS modules 2003 • Continually updated; current version 5.5d • Latest version added Grapher 7 and modified scheduled tasks for data import and plotting.
WinIDP: Features • User defined formats for input, plots, reports • Time dependent constants (repair riser => new elevation) • Manual data entry with shared field conditions • Data import (can be automated / scheduled) • Compatible with Geomation and CSI dataloggers • Recalculate by data set or instrument • Data edit by data set or instrument • Mask data that is questionable • Batch plotting • Network or stand alone • Multiple users (concurrent use) • Internet accessible, WebIDP.
WebIDP • Requires internet explorer and internet access - No local installation. • Data entry • Plots • Reports
WinIDP: Benefits A Good Choice • Supported by COE dam safety people • Tailored for dam instrumentation • Upgrades and costs shared with others • Compatible with other engineering processes and other information systems used in dam safety • Program is free. Pay as you go for support • Don’t reinvent the wheel – improve the wheel if needed.
Data Presentation Time History Plots Positional Plots Multiple Plots Correlation Plots
Guidelines for Presentation • Appropriate scale • Standardize format • Display relevant field conditions • Location and cross section on graphs • Note events and observations that may • explain unusual data • Avoid over crowded plots
Analysis and Evaluation Trends, Patterns and Thresholds Performance Prediction Recent data Historical data Field conditions “Reasonable” limits
Benefits to performance prediction • Quick assessment of dam behavior • Indication that data was collected properly • Field conditions • Alert that readings are outside expected values
Warning for threshold use • Will not reveal plugged instrument • Only as good as data derived from • Should not substitute for thorough data analysis • Thresholds may be applied during • Data collection • Data entry • Data evaluation
Analysis and Evaluation Compare Current Data to Recent data Historical data (established trend) Initial Field conditions Design Prediction / Thresholds Other instrument types
Analysis and Evaluation • Other considerations • Construction activities. • Maintenance of instrument. • Change of procedures. • (i.e. temperature correction; esp. concrete) • Change of equipment or personnel. • Lag time.
Actions after the analyses • Document the evaluation. • Verify suspect readings and readout calibration. • Verify procedures (I.e. different sensitivity setting). • Duplicate reading. • Notify pertinent personnel • Verify with other instrument type • Ask for visual observation of area • Modify collection schedule • Request additional investigation
Actions after the analyses • Reporting Requirements • Annual instrumentation summary and evaluation to Division • Evaluation to be included in Periodic Inspections
Instrumentation Planning • Predict controlling mechanism (I.e. Pool) • Define question to be answered (I.e Cutoff is 90% effective) • Select parameter to monitor (I.e. piezometric elevation) • Predict magnitude of change (I.e. 50 feet) • Select instrument location (I.e. toe of dam) • Select instrument • Select reading frequency • Data collection and management “Geotechnical Instrumentation for Monitoring Field Performance” Dunnicliff, 1993 “Instrumentation of Embankment Dams and Levees” EM1110-2-1908, 30 Jun 1995
Objectives • Learn various methods of data collection, processing, presentation, evaluation and reporting requirements • Identify various factors that influence dam safety instrumentation data.
Conclusion Perform timely evaluation of data to assure that unsafe performance of a structure is detected as early as possible. Instrumentation data is a valuable asset for the life of the structure. Backup the data.
PW-10 PW-08 PW-09 Stilling Basin Flow Dam Centerline
Open-System Piezometer (wellpoint tip)Set in pervious backfillPervious backfill has a drainage collector perforated pipe PW-08 Collector pipe
PW-08 PW-09 PW-10
Piezometer Data Evaluation • What is observed on the plot • Progressive increase in piezometric pressure • Behavior not consistent with previous high pools • Downstream piezometers reflect tailwater (expected) • PW-08 was typically dry (expected) • What factors could be relevant • Time • High pool • Backfill material clogged or collector pipe blockage • Temperature • Coal mine treatment • Piezometer tip clogged or riser cracked • Previous falling head tests (5’ fall in 5 minutes in 2003)
Piezometer Data Evaluation • What actions could be taken • Do not assume impending failure of the dam • Observe the area for distress • Check visually for instrument damage • Notify project staff, management, and other pertinent staff • Perform rising and falling head tests • Sound bottom of hole • Use inflatable bladder to test for breaks in the piezometer • Install additional instrumentation • Analyze wall stability • Increase reading frequency • Automate with alarm callout • Pump down drainage manhole and camera inspect the pipe • Further literature research on foundation treatment
EXERCISE 1: Piezometer Data Evaluation • What would be your recommended threshold for PW-08 • Dry • Tailwater plus 5 feet • What would be your recommended threshold for PW-09 • Tailwater plus 5 feet • Which phases of data collection and evaluation could the thresholds be implemented • Data collection (Automated or Manual) • Data entry • Data plots • Data evaluation