Download
1 / 57
940 likes | 1.59k Views
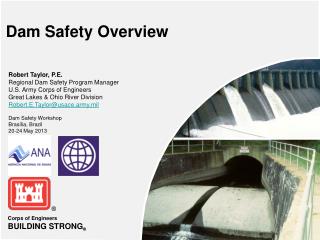
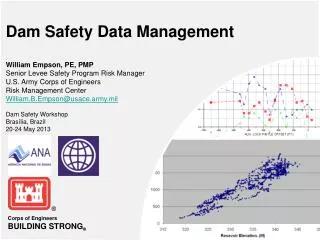
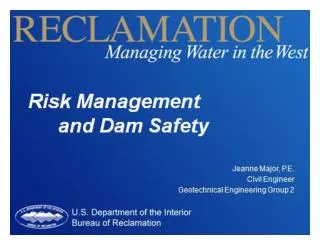
Risk Management and Dam Safety. Reclamation Played a Pivotal Role in Developing Major River Basins in the Western United States. Reclamation is . . . The nation’s largest wholesale water supplier Second largest producer of hydroelectric power in the 17 Western States

E N D
Reclamation Played a Pivotal Role in Developing Major River Basins in the Western United States
Reclamation is . . . • The nation’s largest wholesale water supplier • Second largest producer of hydroelectric power in the 17 Western States • Responsible for more than 600 dams and reservoirs, including Hoover Dam on the Colorado River and Grand Coulee Dam on the Columbia River
1874 – Williamsburg Dam, MA failed • 139 killed • Internal erosion / seepage carried away fill, embankment sliding, then collapse of masonry core wall • Massachusetts enacted legislation regulating dam construction
St. Francis Dam, CA Failed in 1928 • 450 killed • California and neighboring states established dam safety laws in 1929
Dam Safety 1976 Failure of Teton Dam 1978 Reclamation Safety of Dams Act 1979 Federal Guidelines for Dam Safety 1997 and 2003 Guidelines for Achieving Public Protection in Dam Safety Decision Making
Slide 7 Reclamation’s Dam Safety Program Reclamation manages 477 dams and dikes 371 High or Significant Hazard dams and dikes would cause loss of life or significant damages if they would fail and form the core of the Dam Safety Program 7
Dam Safety and Reclamation • Reclamation has 371 high and significant hazard dams • Over 50 % of these dams are more than 50 years old (oldest 100 years old) • Potential loading conditions (floods and earthquakes) have increased for many of the dams • Populations growing downstream of dams
The age of our dams means many have out-dated design and construction practices
Slide 11 Reclamation’s Dam Safety Program Dam Safety Mission To ensure that Reclamation facilities do not present unreasonable risks to the public, public safety, property, and/or the environment. 11
Risk Based Decision MakingRisk Management Process • Use of quantitative risk assessment to inform decision making and to prioritize activities since the 1990’s Examination - Instrumentation DataCollection - Analysis Risk Identification Risk within guidelines? Risk Analysis Risk Evaluation Dam Safety Decision Making Risk Estimates Intelligence
Reclamation’s Dam Safety Process • Ongoing Activities/Risk Identification • Examinations • Monitoring • Comprehensive Facility Reviews • Issue Evaluations • Corrective Action Study • Modifications or other actions
Ongoing Activities • Operations • Maintenance • Site Visits • Routine monitoring • Annual exams • 3 year interval facility reviews
Ongoing Activities • Dam instrumentation monitoring and data collection • Evaluation of instrumentation data • Responses to incidents and poor performance
Ongoing Activities - Comprehensive Facility Reviews • Performed once every 6 years • Evaluation of analysis, design and construction • Identification of potential failure modes • Review of the performance of the dam • Development of performance parameters • Monitoring program to look for possible development of a failure mode.
Comprehensive Facility Reviews • Review of static, hydrologic and seismic loading conditions at the dam • Risk analysis • Field examination team • Underwater & mechanical examinations • Recommendations
What Is Risk Analysis? • Risk can be evaluated by answering… • What undesired event could occur? • How likely is it? • What would happen if it did?
Risk = (Pevent)(Presponse)(consequences) LOAD Floods Earthquake Normal RESPONSE Failure Non-failure CONSEQUENCES Life Loss Economic Environment Cultural
Risk Analysis used in Dam Safety for… • Gaining a better understanding of what can cause the dam to fail • Quantifying the engineering judgments (need to build the case to support the estimates) • Identifying need for additional studies • Setting priorities. Should corrective action take place immediately, next year, in 6 years, etc? • Identifying most cost effective means to reduce risk
The typical steps of a dam safety risk analysis… • Identify failure modes • Determine frequency of loads of concern • Estimate likelihood of failure • Estimate potential life loss • Compute risk and identify uncertainties • Examine the conclusions • Make recommendations
Identify Failure Modes: • Familiar w/ Reclamation and dam building/operation history: Timeline (sample of significant events) 1900 1920 1940 1960 1980 2000 1976: Stagnation pressure failure potential IDed & begin defensive measures implementation. 1967: Sulfate attack virtually eliminated. Late 1940’s: ASR reducing practices implemented. 1933: Internal vibration of concrete used. 1929: Basic principals of concrete materials implemented. 1905-1910: Reinforced concrete used.
Identify Failure Modes Normal loads Internal Erosion
Normal Loads (continued) Foundation Failure
Normal Loads (cont.) Spillway Gate Failure
Flood Loads Dam Overtopping
Estimate Load Probability • Look at full range of loading conditions, not just extreme loads • Provided by specialists • Flood frequency analysis • Probabilistic seismic hazard analysis
Dam Overtopping • Starting reservoir water surface elevation • Flood load ranges • Dam Overtops • Headcutting leads to breach and uncontrolled release of reservoir
Estimate Response Probabilities • Requires the most effort in risk analysis meeting • Made by those most familiar with the behavior of the dam (experts/operators) • The overall dam response is broken into smaller steps that are easier to understand and estimate (event tree) • Analysis results are used when available • Case histories are valuable in making estimates
Static – Internal Erosion of Embankment Material Reservoir at or above threshold level Initiation – Erosion starts Continuation – Unfiltered or inadequately filtered exit exists Progression – Roof forms to support a pipe Progression – Upstream zone fails to fill crack Progression – Constriction or upstream zone fails to limit flows Intervention fails to prevent “break-through” • Dam breaches
Risk Analysis Estimates • Estimates are often limited by lack of information or analyses and studies – creates uncertainty • Sensitivity studies can be performed to evaluate the impact of variability in key nodes
Risk Analysis Estimates • Summarize What is Known and Not Known • More Likely and Less Likely Factors are Identified • A range of estimates is made for a given node
Static – Internal Erosion of Embankment Material Reservoir at or above threshold level Initiation – Erosion starts Continuation – Unfiltered or inadequately filtered exit exists Progression – Roof forms to support a pipe Progression – Upstream zone fails to fill crack Progression – Constriction or upstream zone fails to limit flows Intervention fails to prevent “break-through” • Dam breaches
More Likely Factors Placement techniques may have resulted in segregation Fines content greater than 10% and may allow a sustained crack Less Likely Factors Gradation analysis indicates filter meets no erosion filter criteria Multiple tests exist for both filter and base materials Static – Unfiltered or inadequately filtered exit exists
Virtually Certain Very Likely Likely Neutral Unlikely Very Unlikely Virtually Impossible 0.999 0.99 0.9 0.5 0.1 0.01 0.001 Risk Estimates
Estimate Consequences • Potential loss of life • Based primarily on affected downstream population, available warning time, and estimated severity of the flood wave • Better methods are needed for large populations with limited warning