Linear Regression: Understanding, Implementing, and Analyzing Results
Explore classic linear regression, causality, general frameworks, and diagnostics in detail. Learn to address missing data, categorical variables, lagged variables, and more. Practice through hands-on exercises and interpret regression results effectively.

Linear Regression: Understanding, Implementing, and Analyzing Results
E N D
Presentation Transcript
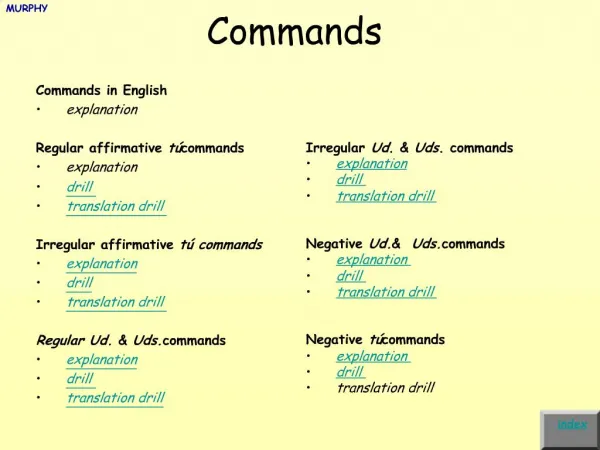
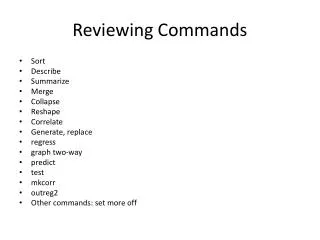
Reviewing Commands • Sort • Describe • Summarize • Merge • Collapse • Reshape • Correlate • Generate, replace • regress • graph two-way • predict • test • mkcorr • outreg2 • Other commands: set more off
Debriefing the Database • What went wrong along the way? • Code mismatch on polcon • Do file won’t run • Creating operator count variable • Missing data • Source: WDI, polcon, operator db • Other?
Linear Regression Y = Xβ + ε βOLS = (X’X)-1X’Y • X’Y = X’Xβ + X’ε • X’ε = 0 by assumption β = (X’X)-1X’Y
Why linear regression? • Good foundation for thinking about all analysis. • criteria for estimators • unbiased: E(β*) = β • efficient: σ2(β*) < σ2(β) • asymptotic properties: plim β* • montecarlo studies for small sample properties • maximum likelihood estimation • given a population distribution, which parameters of the distribution best match the observed data? • For normal error term, βMLE = βOLS • R2 • error term • Many of the problems we discuss in regression are found in the assumptions concerning the error term: probability distribution, variance, correlation ^
Linear Regression & Causality • Define endogeneity: “When there is correlation between a regressor and the error term, that regressor is said to be endogenous” • Measurement error in explanatory variables • Autoregression (lagged variable as predictor) • Simultaneity/Reverse causality • Omitted variable • Sample Selection & unobserved heterogeneity • Missing data • Groups
More general frameworks build from the linear model • (feasible) Generalized Least Squares: GLS or fGLS • Weighted least squares with sample variance/covariance as the weighting matrix • reg3 or xtgls • Generalized Linear Model: GLM • g{E(y)} = xβ, y ~ F • g{} is the link function • F is the distribution family • Classical model with normal errors: • g{} is identity & y ~ Normal • Alternatives: • g{}: logarithmic, logit, probit, complementary log-log, negative binomial • F: normal, binomial, poisson, negative binomial, gamma • glm or xtgee
Rest of class: homework • Discuss missing data: how might it affect your analysis? What do you know about the differences between the known values and the missing values? • Create a categorical variable for polcon • polcon_hi = 1 if polcon is greater than median, 0 otherwise • Scatter plot mobile_subs x polcon_cat • Add a regression line to the scatter plot • Scatter plot mobile_subs x gni/cap • Add a quadratic line • Add a confidence interval to the quadratic line • Create a lagged variable for mobile subs • Build a regression model for mobile_subs • Start with one variable & build to full model • How does the output change? In the final analysis, which variable would you want to start with? End with? • Are there any variables that should not be included? • Which variables have a meaningful effect? • Which variable seems to increase the R2 the most? • Which variable would make the most sense to include with a nonlinear effect? • Diagnostics • graph residuals • Test for equal variance • Graph marginal effect of each variable • Graph predicted y for range of population • Choose two coefficients and test that they are different from one another • Create a correlation table and regression table with your results • Hand in: Corr & Regression tables, graphs of marginal effects, written answers to questions above
Missing Data • Summarize • Compare: pick most incomplete variable • Take a relatively complete descriptive variable, such as pop or GDP • Test if mean is different for observations where the incomplete variable is defined and missing • Sort & browse • Examine observations for differences where the variable is missing
Categorical Variable • Where is the median stored? • Summarize polcon • r(p50) gives the median [r(N), r(mean), r(max), r(Var)] • gen polcon_hi = 0 • replace polcon_hi = 1 if polcon>r(p50) • Scatter mobile_subspolcon_hi • Why doesn’t this look great? • jitter • Add two lines: • Scatter mobile_subspolcon_hi || lfitmobile_subspolcon_hi • Scatter mobile_subspolcon_hi || lfitcimobile_subspolcon_hi
Graph quadratic fit & confidence intervals • Scatter mobile_subsgnipercap • Add a quadratic line • || qfitmobile_subsgnipercap • || qfitcimobile_subsgnipercap
Lagged variable • Start with wdi_mobile • Easy lag: redefine Y2001 as mobile_lag • Reshape long • Hard lag: often necessary • Sort id year • gen mobilesubs_lag = mobilesubs[_n-1] • keep if year==2002 • keep id mobilesubs_lag • merge into database
Regression • regress mobile_subsgdp pop gnipercaptelpolcon ops • graph residuals • rvfplot (vs. fitted), rvpplot (vs. predictor) • test for equal variance • estathettest • test for omitted variable • estatovtest • robust estimation: • “White-Huber heteroskedasticity-consistent estimator”, “sandwhich estimator” “White-washing the data” • regress <outcome variable> <explanatory variables>, vce(robust) • graph added effect of each variable • avplots
Post-estimation • Predict • Predict yhat • Estimates • store output for analysis, eg for hausman test • Test • simple and composite Wald tests • lrtest
Making tables • Correlation table • mkcorr • Regression table • outreg2