Download
1 / 8
80 likes | 312 Views
Business professionals are increasingly looking to big data analysis tools as data consumption increases on a large scale every day. But as these needs develop and the data itself grows, challenges also arise. The creators of ZoomCharts’ data visualization software are constantly looking forward, creating tools to overcome these challenges in our data driven world that will be supported not only by today’s technology, but by the technology of tomorrow. ZoomCharts began as a result of a need to fill in the holes left by other data visualization providers. ZoomCharts developers, recognizing issues such as static data, the inability to handle big data sets, slow data loading, and the lack of mobile support, sought to create a toolset that would solve these problems. ZoomCharts http://www.zoomcharts.com The world’s most interactive data visualization software

E N D
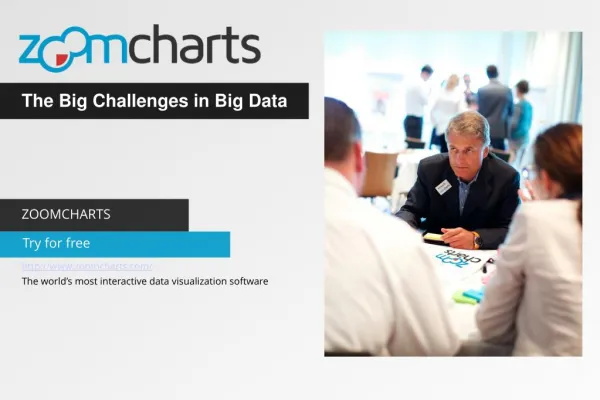
The Big Challenges in Big Data ZOOMCHARTS Try for free http://www.zoomcharts.com/ The world’s most interactive data visualization software
The Big Challenges in Big Data Business professionals are increasingly looking to big data analysis tools as data consumption increases on a large scale every day. But as these needs develop and the data itself grows, challenges also arise. The creators of ZoomCharts’ data visualization software are constantly looking forward, creating tools to overcome these challenges in our data driven world that will be supported not only by today’s technology, but by the technology of tomorrow. ZoomCharts began as a result of a need to fill in the holes left by other data visualization providers. ZoomCharts developers, recognizing issues such as static data, the inability to handle big data sets, slow data loading, and the lack of mobile support, sought to create a toolset that would solve these problems.
The Big Challenges in Big Data • Static Data Having to switch back and forth between separate charts and graphs to go beyond the surface of your data sets and garner relevant meaning can be frustrating. ZoomCharts’ 100% interactive JavaScript graph and chart HTML libraries let you see the big picture and drill down deeper, in one space. All of your information is right at your fingertips, and can be accessed precisely when you want: a time saving approach that reduces clicks by up to 90%. Focus on the data you want, and hide the rest until the moment you need it with an intuitive click, tap, swipe, or pinch.
The Big Challenges in Big Data • Lack of Big Data Support Many data visualization providers offer the ability to transform simple information into impressive visuals, but what’s the point of visual representations that look pretty if they have no functional use? Because data is becoming increasingly complex, what business professionals require today and will certainly require more of in the years to come, is the ability to support more than simple data sets. ZoomCharts charts and graphs are built to handle BIG data, and, unlike many other data visualization providers, without compromising performance.
The Big Challenges in Big Data • Slow Data Loading Often, when HTML5 chart libraries meant only to handle simple data sets try to keep up with demand, annoying lags and wait times result. This completely defeats the purpose of using data visualization to improve efficiency. With ZoomCharts, there is no strain, no struggle, and no waiting around for the information you need to load. Simply click, and you’re there. This gives you time to focus on the things you need to enhance your business practices, which is why you look to big data solutions in the first place.
The Big Challenges in Big Data • Lack of Mobile Support A capable chart library that can handle your data is obviously a main priority, but in today’s mobile world, so is the ability to access your data on the go. With ZoomCharts software, your data goes where you go. Access your data on any device, on everything from desktops, to laptops, to tablets, smart phones, and even interactive walls! These are some of the many ways, through anticipating future needs based on current technology trends, that ZoomCharts developers are bringing data analysis and presentation to the next level.
Check out ZoomCharts products: Network Chart Big network exploration Explore linked data sets. Highlight relevant data with dynamic filters and visual styles. Incremental data loading. Exploration with focus nodes. Time Chart Time navigation and exploration tool Browse activity logs, select time ranges. Multiple data series and value axes. Switch between time units. Pie Chart Amazingly intuitive hierarchical data exploration Get quick overview of your data and drill down when necessary. All in a single easy to use chart. Facet Chart Scrollable bar chart with drill-down Compare values side by side and provide easy access to the long tail. ZoomCharts http://www.zoomcharts.com/ The world’s most interactive data visualization software