Download
1 / 9
90 likes | 268 Views
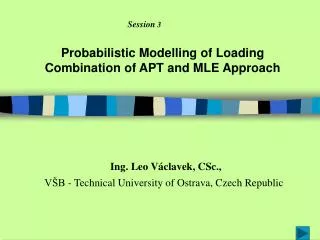
Session 3. Probabilistic Modelling of Loading Combination of APT and MLE Approach. Ing. Leo Václavek, CSc., VŠB - Technical University of Ostrava, Czech Republic. Loading of Structure. D i dead loads , time independent, most frequently normal distribution is used.

E N D
Session3 Probabilistic Modelling of Loading Combination of APT and MLE Approach Ing. Leo Václavek, CSc., VŠB - Technical University of Ostrava, Czech Republic
Loading of Structure Didead loads, time independent, most frequently normal distribution is used LLi, LSilive loads (random long-term and short-term), load data (histograms) obtained by measurements at determinate time interval Wwind loads, load data (histograms) obtained from measurements EQextraordinary, great intensity loading, its duration inconsiderable with respect to return period (earthquake,…) Find: Histogram for combination of load effects
Analysis of simultaneous load effects - 1 APT (Arbitrary Point in Time) approach • individual loads are expressed by Load Duration Curves (LDC) Curve LDC is inverse of Cumulative Distribution Function (CDF) • Monte Carlo simulation (in SBRA method) is used and for chosen “arbitrary point in time” the combination of all load effects is defined • histogram for combinations of load effects is obtained by many times repeated random choise of loads Remark This approach respects not only frequency of the various magnitudes of load during the life of structure, but also time intervals when load is zero.
Analysis of simultaneous load effects - 2 MLE (Maximum Load Effect) conception • the combination of effects of all loads is analyzed only in relatively short time interval, which relates to the acting of extraordinary load, e.g. earthquake • all other (conventional) loads are combined in accordance with conception APT Note: See study by LI, W.C., MAREK,P., CHEUNG, M.S., (Proceedings Vol. 1 [5] )
Evaluation of the Probability of Failure Pf Probability of appearance of unfavourable events (excess of the reference value RV) APT - during the all life of structure. As time duration of extraordinary great intensity loading is inconsiderable with respect to its return period, consistent calculation would require implementation of outsize histograms and great number of simulation steps MLE - conduce to probability failure assessment in the spell when extraordinary load comes into being Important difference Considerable different target probabilities Pd match to conception APT and MLE
Combination of APT and MLE approach Following histograms and LDC could be used for modelling of the different time duration of the extraordinary loading . (a) (b) (c) LDC and histograms When (a), (b) and (c), is used, then 7.6%, 69.8% and 97.5% respectively of the total service life the structure is exposed to extraordinary loading. When zero value is eliminated, most frequent values are around ±0.75.
APT - targetprobability Pd = 0.00007 (ČSN 73 1401 Appendix A) MLE - target probability Pd = 0.023 (Galambos, T.V.,…, 1982) Earthquake loading A: EQ=0.02Fi,, B: EQ=0.03Fi, C: EQ= 0.04Fi, For more detailes see Proceedings Vol.1 [6]
(a) (b) (c) Load Duration Curves and histograms (a) dead load - histogram Dead1 (b) random long lasting load - histogram Long2 (c) random short lasting load - histogram Short1
Load Duration Curve and histogram Wind1 Steel A36yield stress, histogram A36-m