Download
1 / 33
330 likes | 407 Views
This paper presents a probabilistic diagnosis approach for selecting and monitoring rover navigation modes to prevent and recover from mobility faults. It discusses various navigation modalities, adaptability to different environments, and setting up a probabilistic network for mode selection. The approach involves context information, on-line monitoring, and using state transition probabilities.

E N D
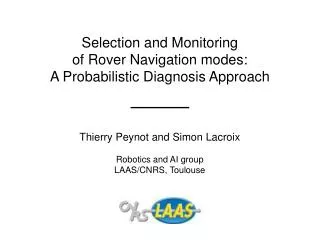
Selection and Monitoring of Rover Navigation modes: A Probabilistic Diagnosis Approach Thierry Peynot and Simon Lacroix Robotics and AI group LAAS/CNRS, Toulouse
Opportunity traverse A great success story
A great success story Opportunity traverse April 26th, 2005
Problem statement Prevent (or at least detect) mobility faults Recover from faulty situations • A diagnosis problem
Various navigation modalities • Large variety of environments: need for adaptation
(various other locomotion modes possible) … Various navigation modalities • Large variety of environments: need for adaptation • Various locomotion modes rolling mode « rolking » mode
Various navigation modalities • Large variety of environments: need for adaptation • Various navigation modes (i.e. various instances of the perception / decision / action loop) Plus: reactive navigation, trail following, visual servoing, … « 2D » mode « 3D » mode Road following Plus: the STOP mode ! (Back to the MERs: Direct control, AutoNav, VisOdom)
Probabilistic diagnosis approach: Network of state transition probabilities Overview of the approach • The robot is endowed with k navigationmodes mk • Problem: determine the best mode m* to apply, considering : • “Context” information related to the environment (a priori information) • Behavior information acquired on-line (thanks to “monitors”)
Outline • Problem statement and approach • Context information • On-line monitoring • Setting up the probabilistic network
1. From initial data (aerial data, GIS…) traversability landmarks Navigation supports DTM / Orthoimage… … structured into navigation models Context information Requirement: an environment representation that expresses the applicability probabilities for each considered mode
Global model update Context information Requirement: an environment representation that expresses the applicability probabilities for each considered mode 2. From data gathered by the robot : terrain classification Disretization Probabilistic classification
Context information Requirement: an environment representation that expresses the applicability probabilities for each considered mode 3. From data gathered by the robot : DTM analysis Evaluation of robot placements on the DTM DTM “Difficulty” index
Fast 2D mode Forbidden Slow 3D mode Context information Requirement: an environment representation that expresses the applicability probabilities for each considered mode 4. From an analysis provided by the operators :
Outline • Problem statement and approach • Context information • On-line monitoring • Setting up the probabilistic network
Monitoring the behaviour Requirement: to evaluate the adequacy of the current applied mode • Principle: check perceived signatures wrt. a model of the mode • A monitor is dedicated to a given mode (generic monitors can be defined though)
supervised bayesian classification (3 states: no slippages, slippages, fault) Monitor 1 : locomotion efficiency For a 6 wheels rover: • Consistency between individual wheel speeds • Consistency between rover rotation speed estimates (odometry vs FOG gyro)
Monitor 1 : locomotion efficiency For a 6 wheels rover: • Consistency between individual wheel speeds • Consistency between rover rotation speed estimates (odometry vs FOG gyro) Associated state transition network (2 states: rolling, rolking, P(rolling) = 0.8)
Monitor 2 : FlatTerrain assesment FlatNav mode: simple arc trajectories generated on an obstacle map • Analysis of the attitude angles measured by the IMU
Monitor 3 : Attitude assessment on rough terrains RoughNav mode: trajectory selection on the basis of placements on the DTM • Comparison between the predicted and measured rover attitudes along the trajectory
Monitor 3 : Attitude assessment on rough terrains RoughNav mode: trajectory selection on the basis of placements on the DTM • Comparison between the predicted and measured rover attitudes along the trajectory predicted measured
Monitor 3 : Attitude assessment on rough terrains RoughNav mode: trajectory selection on the basis of placements on the DTM • Comparison between the predicted and measured rover attitudes along the trajectory Predicted vs. observed robot pitch angle
Stability margin analysis Other possible monitors Visual servoing modes (trail following) Analysis of various localisation estimates (odoMetry, visOdom, Inertial navigation…) And many others…
Outline • Problem statement and approach • Context information • On-line monitoring • Setting up the probabilistic network
Observation Model (Context Information) Conditional Dynamic Model (Transition Probabilities) Conditional Probability (that mode mk should be applied) (O = context info, C = behavior monitors) Setting up the probabilistic network Network of state transition probabilities
3. Difficulty map Difficulty [0,1] Pseudo-probability From context information to probabilities 1. Aerial images analysis: probabilistic classification, OK 2. Terrain classification from rover imagery: probabilistic classification, OK 4. Information given by the operator: to be conformed with probabilities
From monitor signatures to probabilities Locomotion efficiency monitor: bayesian classification, OK
From monitor signatures to probabilities Locomotion efficiency monitor: bayesian classification, OK FlatTerrain assesment Signature “conformation” Pseudo-probabilities
Signature “conformation” Pseudo-probabilities From monitor signatures to probabilities Locomotion efficiency monitor: bayesian classification, OK FlatTerrain assesment Attitude assesment Signature “conformation” Pseudo-probabilities
Merging monitors and context information Example: • Two navigation modes: flatNav and roughNav (+ stop) • Context information: difficulty map computed on the DEM • Two monitors: flatTerrain and attitude assessment
Merging monitors and context information Example: • Two navigation modes: flatNav and roughNav (+ stop) • Context information: difficulty map computed on the DEM • Two monitors: flatTerrain and attitude assessment
Take home message Navigation diagnosis is essential
Take home message Navigation diagnosis is essential From a research scientist perspective: • Reinforce links with the FDIR/Diagnosis community • Probabilistic diagnosis approaches seems appealing (but calls for lot of programmer expertise and tuning) • Consider integration with the overall rover decisional architecture From an engineer perspective: • Many simple ad hoc solutions are possible
Back to Opportunity No discriminative context information… Two possible monitors: • Comparison of visOdom / odometry motion estimates • Surveillance of the current consumptions / wheel individual speeds (cf [OJEDA-TRO-2006])