Download
1 / 34
340 likes | 528 Views
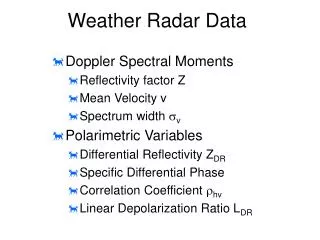
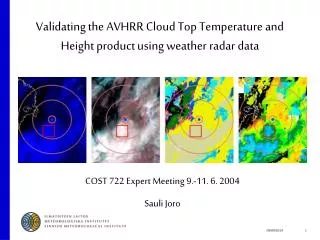
Validating the AVHRR Cloud Top Temperature and Height product using weather radar data. COST 722 Expert Meeting 9.-11. 6. 2004 Sauli Joro. Outline. Introduction Weather radar & TOPS product Cloud Top Temperature and Height product Data Product comparison Results Summary. Introduction.

E N D
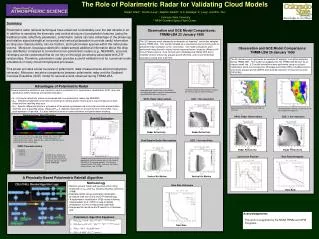
Validating the AVHRR Cloud Top Temperature and Height product using weather radar data COST 722 Expert Meeting 9.-11. 6. 2004 Sauli Joro
Outline • Introduction • Weather radar & TOPS product • Cloud Top Temperature and Height product • Data • Product comparison • Results • Summary
Introduction • Visiting Scientist Activity within EUMETSAT SAFNWC framework • EUMETSAT Satellite Application Facilities (SAFs) are programs specialized in developing and processing satellite data • SAFNWC is consentrated on nowcasting and very short range forecasting
The Cloud Top Temperature and Height (CTTH) product is developed within the SAFNWC framework • Objective is to validate CTTH product with weather radar data – known to be very ambitious • Study mainly concentrated on opaque and semi-transparent high clouds (clouds containing ice)
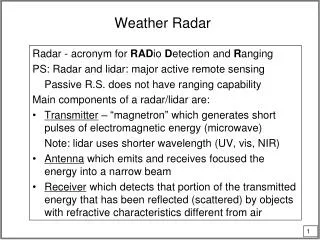
Weather radar & TOPS product • ”Direct” cloud measurement with good temporal and spatial resolution
water: 0.93 ice: 0.176 Experimental ice particle distributions in different cirrus clouds (Liou, 1992).
”What is the threshold value for an echo in dBZ to be considered as the cloud top?” • FMI & Finnish Air Force: ”in case of ’raining cloud’ treshold value of –10 dBZ should give reliable cloud top heights” • Poutiainen (1999): ”Various cirrus types can create Z values between –15 - +5 dBZ • -5 dBZ and -10 dBZ selected to represent the true tops of ice clouds
Thick cirrus on RHI screen taken from Radar Vantaa on 25 June 1998 at 10:59 UTC (Poutiainen, 1999)
Thin cirrus on RHI screen taken from Radar Vantaa on 22 July 1998 at 07:29 UTC (Poutiainen, 1999)
TOPS product • Uses 3-D weather radar data • Vertical resolution 100 m • For each pixel downward search in cylindrical coordinates at constant range for the chosen dBZ treshold value and determines if it is crossed -> interpolation
CTTH product • Aims providing reliable estimates of the cloud top temperature and height for all the cloudy pixels within an AVHRR scene • Vertical resolution 200 m • Consists of two algorithms: one for opaque and one for semi-transparent cloudiness • Results of Cloud Mask and Cloud Type products used as input data
CTTH opaque retrieval • Applied to all pixels classified as ’opaque’ by the Cloud Type product • Based on Radiative Transfer Model simulations and results of NWP model • For each pressure level the RTM simulates the AVHRR channel 4 cloudy brightness temperature -> the best fit to the measurement is selected -> CTH from NWP
CTTH semi-transparent retrieval • Measurement itself is ”contaminated” as the radiation from the surface is partly passed through the cloud -> brightness temperatures too warm • Method uses AVHRR channels 4 and 5 brightness temperatures • Result is applied to all pixels within an imagesegment classified as semi-transparent
semi-transparent clear opaque Example distribution of 32x32 pixel size image segment. • Single cloud layer • Constant absorption coefficient throughout the cloud layer • Brightness temperature depends linearly on radiance • No atmospheric absorption • Local thermodynamic equilibrium thermodynamic cloud top temperature
Data • Selected time period April and May 2003 • 301 satellite overpasses • FMI radar data, 15min temporal resolution • NWP used: HIRLAM • RTM used: RTTOV
Maximum elevation angle sets a certain minimum distance for cloud top height detection • Radar sensitivity sets a maximum distance for each dBZ value ”Donuts” around radar sites • Proper –10 dBZ cases only from Radar Utajärvi • Cases divided into two sub-categories -5 dBZ and -10 dBZ Radar data features
Product comparison • Cases selected subjectively from AVHRR imagery together with Cloud Type and CTTH product outputs
Simple comparison method used – data may not be normally distributed • Pixel-by-pixel comparison not reasonable -> data needs to be averaged • Data is classified to histogram with 200 m class intervals -> resolution difference vanishes • Modes are taken as the results of the products • Mode difference = TOPS – CTTH • Comparison is considered to be successful if the absolute value of mode difference is less than 500 m
Results both -5 dBZ and -10 dBZ cases 41% success TOPS-CTTH
radar echoes below 2000m discarded -10 dBZ applied to all cases 57% success TOPS-CTTH
no discarded echoes cases within r-10 coverage area 75% success TOPS-CTTH
timing -2 minutes Case A: Opaque high cloud from Radar Ikaalinen -5 dBZ coverage. Satellite over pass is received on 1 May 2003 at 10:43 UTC.
timing -3 minutes Case B: Opaque high cloud from Radar Anjalankoski -5 dBZ coverage. Satellite over pass is received on 29 April 2003 at 19:15 UTC.
timing -6 minutes Case C: Semi-transparent high cloud from Radar Utajärvi -10 dBZ coverage. Satellite over pass is received on 13 May 2003 at 10:47 UTC.
Summary • A new approach for the CTTH product validation presented • The approach presented here uses 3D radar data • Result interpretation very challenging as both methods are based on numerous assumptions – lots of different error sources
Results on the opaque high cloud categoty promising – more than 55% of the comparisons successful • Still lots of unsuccessful comparisons with no explicit explanation, also Cloud Type misclassifications occurred • -10 dBZ proved to be a good first guess for the top heights of thick ice clouds
Results on semi-transparent high cloud category disappointing with only three successfull comparisons • -10 dBZ threshold turned out to be too high for the semi-transparent high clouds and more sensitive values should be applied in the future
Conclusion A weather radar is not the best possible tool for the CTH validation, however, it can offer valuable information about the cloud tops in various situations being at its best when the cloud consists lots of ice particles. The lack of 45-degree elevation angles limited proper -10 dBZ cases to Radar Utajärvi
Report available at http://www.smhi.se/saf