Download
1 / 27
270 likes | 510 Views
Education Longitudinal Study of 2002. NSF Summer Data Policy Institute. July 22, 2007. Objectives of ELS: 2002. Monitor the critical transitions made by a cohort of high school sophomores (10 th graders) through college into their adult careers

E N D
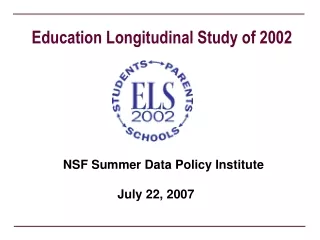
Education Longitudinal Study of 2002 NSF Summer Data Policy Institute July 22, 2007
Objectives of ELS: 2002 • Monitor the critical transitions made by a cohort of high school sophomores (10th graders) through college into their adult careers • Maintain comparability with NLS-72, HS&B, and NELS:88 to measure trends in transitions and outcomes over time • Link the assessment of achievement outcomes to other high school assessments (NAEP and PISA) for purposes of analysis • Focus 2nd follow-up on issues of college access and choice
ELS: 2002 Basic Survey Design • Stage 1: School selection • Target population: schools with 10th graders • Probability of selection proportional to school size • Stratification: region x urbanicity x school control • Total strata: 96 • Over sampled: Catholic schools, and other private • Final sample size: 752 responding schools with a 10th grade • Similar to NELS:88 but starts in spring of 10th grade
ELS: 2002 Basic Survey Design • Stage 2: Student selection • Random selection of about 26 students per school • From student rosters provided by school • Number of students per school was limited to minimize burden • Rosters organized by four race/ethnicity groups • Over-sampled: Asians/Pacific Islanders • All ELL and special education students included (expanded sample) • Sample size: 17,591 10th grade students selected representing 3.6 million students
ELS: 2002 Basic Survey Design • Contextual data sources: • One parent per student • Two teachers per student • One a mathematics teacher of the student • One an English/language arts teacher • Principal of the school • School characteristics • School librarian/media center director • Planned follow-ups: • First follow-up, high school seniors (2004) (done) • Second follow-up, college sophomores (2006) • Third follow-up, eight years after high school (2012)
Sample Design and Weights • Schools and students are assigned weights according to their probabilities of selection. • Use of these weights in analyses is necessary to obtain accurate population estimates. • Values of the weights for school and student sample members are inversely proportional to their probabilities of selection.
Sample Design and Weights • School Weights – • E.g., Stratum H in the Pacific region contains 80 public, urban, schools • If two schools are chosen (H1 and H2), the school weight for each one is 80/2=40 • So each sampled school in stratum H represents 40 schools with a 10th grade.
Sample Design and Weights • Student weights – • Roster of all 10th graders enrolled in spring 2004 was provided by the selected school • If school H1 had 120 sophomores and 24 were selected, then the “within school weight” for each student would be 120/24 = 5. • The overall weight for these students would be 40 x 5 = 200.
Sample Design and Weights • Base Year student weights: • The result is a Base Year student weight for every individual in the sample corresponding to the number of individuals in the population that person represents. • The distribution of these weights is:
Sample Design and Weights • Base Year school weights: • For purposes of analyzing schools, there is also a school weightfor the Base Year schools. • The distribution of these school weights is:
Sample Design and Weights • Between the Base Year and First Follow-up, • Some student do not respond, and • Some students migrate to new schools • In ELS, the sample weights are adjusted to account for for sample member non-response • Using model-based methods • The total weight for Base Year cohort does not change. • All students who transferred to another school were included in the First Follow-up data collection
ELS: 2002 Sample Distribution Source: ELS 2002 data file
Sample Design and Weights Additional measures to correct for non-response: • Non-respondents are included in follow-ups • Receive special questionnaires to obtain data otherwise collected in previous follow-up • Universe variable, F1UNIV1, shows the F1 respondents who were non-respondents • All of the main student background variables (sex, race, SES, etc.) and some status variables are imputed
Sample Design and Weights • After imputation and non-response adjustment, a panel weight, F1PNLWT,is formed from sample members for whom there is response data in both the Base Year and First Follow-up. • This panel weight should be used whenever change in a variable from BY to F1 is analyzed. • This panel weight is zero for all students for whom BY-F1 information is not available • The sample of cases still represents the distribution of the original Base Year Cohort
Sample Design and Weights • For all students who completed a First Follow-up questionnaire, there is also a questionnaire weight, F1QWT • F1QWT includes the freshened sample and all other students in Base Year or Transfer schools who completed a First Follow-up questionnaire, including dropouts, etc. • The cross-sectional sample of seniors is formed by crossing F1QWT with a cohort flag, G12COHRT, identifying all in-school seniors in the First Follow-up.
Design Effects and Standard Errors • Because of the selection of multiple students per school, the ELS sample is “clustered” • Because of this clustering, the standard errors of population estimates are larger than they would be with simple random sampling (SRS) • The extent of departure is measured by the “Design Effect” or DEFF • Because of the “DEFF,” special software must be used to correctly estimate standard errors
Design Effects and Standard Errors • In general, DEFF is defined as the ratio of, • the square of the “correct” standard error by • the square of the standard error of the estimate assuming simple random sampling (SRS). DEFF = (correct S.E.2 / (SRS S.E.)2
Design Effects and Standard Errors Mean and root design effects for NELS:88 and ELS:2002 sophomore cohort panel estimates
Base Year survey Spring 2002 sophomores Student questionnaire Student cognitive tests Mathematics Reading Parent questionnaire Teacher questionnaires Principal questionnaire (school information) Library/media questionnaire School facilities checklist Geocoded data available First Follow-up survey Spring 2004 seniors Student questionnaire Transfer student quest. Dropout questionnaire Early graduate quest. Home school quest. New student quest. Student cognitive tests Mathematics Principal questionnaire (school update) High school transcripts Survey Components
ELS Results: Educational Expectations Percentage of 12th graders who expected to attain a bachelor’s degree or a graduate or professional degree: 1981-82, 1991-92, and 2003-04. 86 86 67 64 63 51 44 32 16 High SES Low SES Middle SES Bachelor’s degree Graduate or professional degree
Second Follow-up Two years after high school Young adult questionnaire High school completion update College choice College enrollment College major Employment (and military service) Life course (living situation, volunteer work, expectations Administrative records Federal student aid received SAT/ACT scores GEDs received Third Follow-up Eight years after high school Adult questionnaire College enrollment College completion status Employment Life course (living situation, volunteer work, expectations) College transcripts Survey Components
ELS High School Transcripts • Sample: • Collected from Base Year school, and • If in another school, from last school of attendance • Provides a complete record of high school coursework • Course titles, grades earned, credits earned, year taken, grades 9-12 • Coded according to course classification schemes • Includes updated high school completion status • Diploma or certificate of attendance • GED • Still in school
ELS High School Transcripts Ninth and eventual 12th grade mathematics course completed : 2004 • Among students who complete geometry in the ninth grade, 84% take Advanced mathematics (trigonometry-pre-calculus or calculus) by the 12th grade • Among students who take general or applied mathematics in the ninth grade, 10% take Advanced mathematics Percent completing specific course by end of high school
Trend analysis with ELS, NELS, HS&B CT HT CT HT CT HT
Availability of Restricted Data • Restricted data files • Use requires a licensing agreement with NCES • “Restricted” files contain information not on the “Public Use” data files • Linking variables • Course records from student transcripts • No top or bottom coding • Released on CD-Roms with the same ECB and kinds of documentation as Public Use files. • http://nces.ed.gov/pubsearch/licenses.asp
Education Longitudinal Study: 2002 For additional information: • Go to ELS: 2002 web site on the NCES web site: nces.ed.gov/surveys/els2002 • To obtain Public Use data files: click on “Order CDs” at the URL above • Sign up for the “High school longitudinal studies” News Flash on the NCES web site