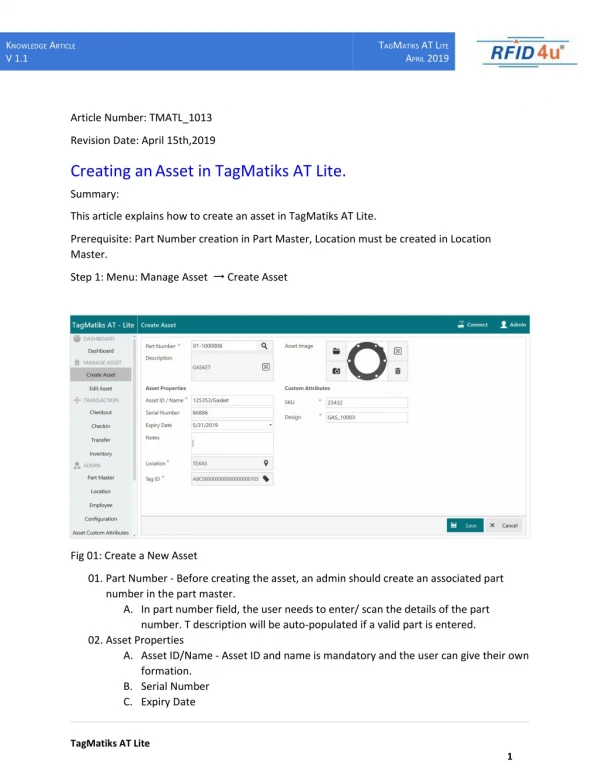
Commodity as An Asset Class
400 likes | 562 Views
Commodity as An Asset Class. FINANCIAL MARKETS. CAPITAL MARKET. DEBT MARKET. FOREX MARKET. COMMODITY MARKET. MONEY MARKET. MUTUAL FUNDS. Overview of Presentation. Supply/Demand and the ‘New consumers’ Other Factors too: - The US Dollar – outlook

Commodity as An Asset Class
E N D
Presentation Transcript
FINANCIAL MARKETS CAPITAL MARKET DEBT MARKET FOREX MARKET COMMODITY MARKET MONEY MARKET MUTUAL FUNDS
Overview of Presentation • Supply/Demand and the ‘New consumers’ • Other Factors too: • - The US Dollar – outlook • - Real Interest Rates – not rising … • - The Commodity Cycle - lasts years … • - Massive Reserves - Developmental demand • - The Economic Cycle • Portfolio Diversification With Commodities • - Better Returns • - Diversification benefits • - Hedge Against Inflation • - Scenario Analysis • India Story
World Demand – New Consumers Aluminum: pounds per capita consumption Source – World Meta Bureau
World Demand – New Consumers Steels: pounds per capita consumption Source – World Meta Bureau
We could say… • If supply cannot expand at the rate of intended demand, the price of commodities MUST rise in order to squeeze demand back to the available supply. • In the true sense; a rising price is the market’s way of rationing demand. • Accordingly, central banks run serious risks by tightening monetary policy in hopes of suppressing the rise in commodity prices.
Other Factors: the US Dollar The Dollar broke down in 2002 … Created Using Metastock
Other Factors: the US Dollar In fact, the gold price often turns with US$ … Created Using Metastock
Commodity Prices and US$ So does S&P commodity price index … USD Index S&P Commodity Index Created Using Metastock
The Outlook for the US Dollar The RMB and Asian currencies must rise! Source - IMF
We could say… • When the dollar declines against the Asian currencies: • Local demand picks up • Local prices eventually start rising … • But since Asian consumers are driving commodity prices, the dollar’s decline against • Asian currencies is far more important for commodities than other factors such as the • dollar’s relationship with say the Euro! • 2010 Phenomenon: Gold & Euro: • Sudden payment crisis in some EC countries (Greece/Portugal/Spain/Ireland) caused a • loss of confidence in the Euro
Commodity Prices and Interest Rates … with the S&P Commodity Index …
News: 15th November 2010 Gold gained half a % on Monday, after falling three % in the previous session on talk of an imminent interest rate hike by China that triggered a broad commodities decline. Copper fell on Friday, receding from the previous session's record high to hit a one-week low on talk of an interest rate hike in top consumer China, but analysts said good fundamentals supported the metal longer-term. Oil prices slumped more than 3 % on Friday, retreating from a 25-month high, amid a broad commodities rout on fears that China may raise interest rates to brake its economy and concerns about euro zone debt.
We could say… • When real interest rates (inflation-adjusted) decline, demand for • goods and services generally responds positively • This demand is reflected in the demand for raw material in general • and key commodity prices specifically • In fact, the data shows that both the Dollar and real interest rates are • negatively correlated with commodity prices
The Commodity Cycle The shortest copper cycle lasted 16 years Tube Sheets Wires COMEX Copper Prices from Jan 1988- Oct 2010 50 day Moving Average
The Gold Cycle The shortest gold cycle lasted for 10 years…
COMEX Gold Prices from Jan 1979- July2010 50 day Moving Average The Commodity Cycle The shortest gold cycle lasted for 10 years…
The Wheat Cycle The shortest wheat cycle lasted 16 years
The Commodity Cycle NYMEX Crude Oil Prices from Jan 1980- July2010 Subprime crisis Iraq War Gulf war 50 day Moving Average
Reserves Source - IMF
Investment Demand in Commodities Commodity “asset class” room to grow!
Opportunities in Commodities Commodity “asset class” room to grow! • The value of managed assets in the world is about $55 trillion … • Estimates suggest that only $175-200 billion of this is invested in • commodities • Assuming that the “commodity asset class” will grow to about 3% of all • assets … • There could be an 8-fold increase in commodity investments!
The Economic Cycle … and generally decline during/after recessions
Goldman Sachs Index Recessionary phase
Commodity Prices Source: IMF
Conclusion… • The dollar has a major impact on commodity prices … • So do real interest rates … • The commodity cycle generally lasts for years • The Commodity complex has become an “investment class” • Recessions damage commodity prices • Recovery pushes up prices
Commodity Delivers Better Returns …absolute and risk adjusted returns… The average historical risk premium of Commodity Futures has been about 5% per annum during the period from 1959 to 2010.
Diversification Benefits …when other disappoint, commodities stands!!! Commodity prices and prices for stock and bonds respond differently to changes in market and economic conditions. The difference in how they respond to global events and the timing to these responses can provides commodities with valuable benefits when combined with other financial assets. Source – DataStream
Diversification Benefits …the importance of negative correlation… Portfolio I Consider a position consisting of a USD 1,000,000 investment in S&P 500. The daily volatility for S&P 500 is 1.37% (2nd Jan, 2009 to 30th May, 2009). VaR for S&P 500 Since size of the position is USD 1 million, the standard deviation of daily changes in the value of the position is 1.37% of USD 1 million or USD 13700. The 1-day 99% VaR of a USD 1 million position in S&P is 2.33*13700 = USD 31921
Diversification Benefits …the importance of negative correlation… Portfolio II Position consisting of a USD 1,000,000 investment in Gold. The daily volatility for Gold is 1.44% (2nd Jan, 2009 to 30th May, 2009) VaR for Gold Since size of the position is USD 1 million, the standard deviation of daily changes in the value of the position is 1.44% of USD 1 million or USD 14400. The 1-day 99% VaR of a USD 1 million position in S&P is 2.33*14400 = USD 33552
Diversification Benefits …the importance of negative correlation… So if we combine these two Single-Asset Case portfolio and form a new Two-Asset Case portfolio the VaR for the portfolio should be??? Simple – Sum of the VaR for the two portfolio’s, Right??? Therefore VaR for this portfolio is USD 31921 + USD 33552 = USD 65473 No !! Correlation gets involved here. If S&P 500 and gold were perfectly correlated (+1), the VaR for the portfolio would equal the VaR for the S&P 500 plus the VaR for the gold (31921+33552 = 65473). Less than perfect correlation leads to some of the risk being “diversified”. IF Correlation between both the asset classes during the given time period is -0.71
Diversification Benefits …the importance of negative correlation… VaR for the portfolio The standard deviation of the change in the value of the portfolio consisting of both stocks over a one-day period is therefore SQRT (13700^2+ 14400^2+ (2*-0.71*13700*14400)) = USD 10719 The 1-day 99% VaR for the portfolio is therefore 2.33*10719 = USD 24977 The amount (31921 + 33552) – 24977 = USD 40496 represents the benefits of diversification. IMPORTANTLY COMMODITY HAS HISTORICALLY PROVIDED DIVERSIFICATION DUE TO LOW OR NEGATIVE CORRELATION WITH OTHER ASSET CLASSES!!!
In Summary, Commodities Offer: • Positive Expected Risk Premium • Strong Diversification Effects • Unique Risk Hedging • Benchmark Choices • Variety of Investment Vehicles
Thank You! DISCLAIMER: The Information in the presentation is solely for informational purpose and should not be regarded as a recommendation by FTKMC. All information in the presentation is obtained from the sources believed to be reliable and FTKMC or any of the associate entities make no representation as to its completeness or accuracy. FTKMC accepts no obligation to correct or update the information or opinion. No member of FTKMC or its associate entities accept any liability whatsoever, or other loses arising from the use of the material in the presentation and or further communication in relation to this presentation.