Download
1 / 24
240 likes | 322 Views
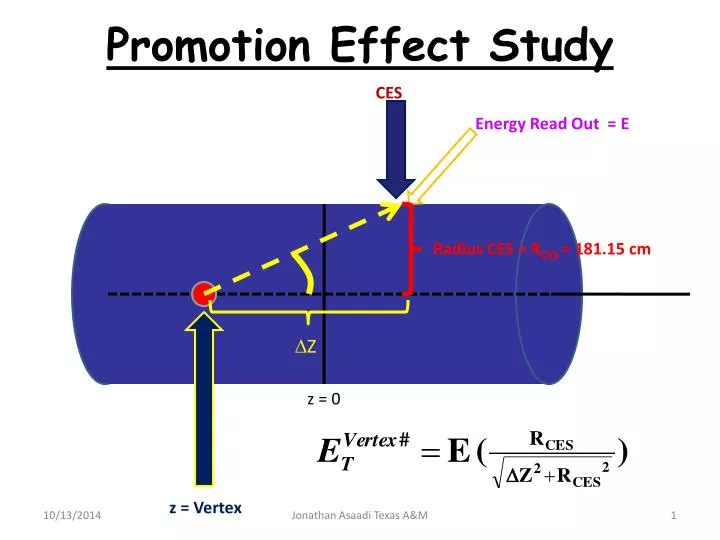
Promotion Effect Study. CES. Energy Read Out = E. Radius CES = R CES = 181.15 cm. D Z. z = 0. z = Vertex. 10/13/2014. Jonathan Asaadi Texas A&M. 1. Event Selection Flow Diagram. Selected on WNOTRACK Trigger # of Events = 291,518 L = 570 pb -1. Pre-Selection Cuts. Pre-Sample

E N D
Promotion Effect Study CES Energy Read Out = E Radius CES = RCES = 181.15 cm DZ z = 0 z = Vertex 10/13/2014 Jonathan Asaadi Texas A&M 1
Event Selection Flow Diagram Selected on WNOTRACK Trigger # of Events = 291,518 L = 570 pb-1 Pre-Selection Cuts Pre-Sample # of Events = 152,118 Photons are required to be CentralPhotons and must pass standard Isolation, Fiducial, and Identification cuts except for CES c2. Electron Track is removed from Vertexing
Event Selection Flow Diagram Selected on WNOTRACK Trigger # of Events = 291,518 L = 570 pb-1 Pre-Selection Cuts Pre-Sample # of Events = 152,118 Right Vertex Wrong Vertex Right Vertex Pre-Sample # of Events = 123,079 Wrong Vertex Pre-Sample # of Events = 29,039
Right Vertex Pre-Sample Plots Wrong Vertex Right Vertex Validation Plots: Coming from Right Vertex Pre-Sample Events Entries: 152118 Mean: - 0.0006 RMS: 1.139 # of Events / 0.5 ns tcorr
Right Vertex Pre-Sample Plots t Vertex (Space-Time Vertexing) Z Vertex (Space-Time Vertexing) z (cm) t (ns)
Right Vertex Pre-Sample Plots Vertex Time vs Z t (z) = 0.0042z + 0.069 # of Events vs Run Number Only Difference is in the binning
Right Vertex Pre-Sample Plots Mean Vertex Time vs Run Number t (run#) = -5.47e-07RunNumber + 0.031 Mean Vertex Z vs Run Number z (run#) = -4.52e-05RunNumber -7.76
Right Vertex Pre-Sample Plots Electron Track Information Z Electron Track T Electron Track z (cm)
Right Vertex Pre-Sample Plots Electron Track Information Electron h Electron f h
Electron Track Information Track Time vs Z t (z) = 0.0047z -0.039 Phi vs Electron Time Eta vs Electron Time
Event Selection Flow Diagram CES Selected on WNOTRACK Trigger # of Events = 291,518 Energy Read Out By The CEM Pre-Selection Cuts RCES = 181.15 cm Pre-Sample # of Events = 152,118 DZ DZ Right Vertex Wrong Vertex Right Vertex Pre-Sample Events w/ a second Vertex # of Events = 14,667 Select Events that have a second vertex in the event Wrong Vertex Pre-Sample # of Events = 29,039 Right Vertex Pre-Sample # of Events = 123,079 2nd Vertex w/ NTracks >= 3, |T0|< 5 ns, |Z0|< 60 cm, and SPt> 5 GeV Calculate the Et for the electron as if it came from either vertex = Vertex 1 (Right Vertex) = Vertex 2 (Second Vertex)
Et Distributions CES Energy Read Out By The CEM RCES = 181.15 cm Right Vertex Pre-Sample Events w/ a second Vertex # of Events = 14,667 DZ DZ Et Right Vertex Et Second Vertex Et Second Vertex Et Right Vertex = Vertex 1 (Right Vertex) = Vertex 2 (Second Vertex)
Looking for Promotion Effect CES Energy Read Out By The CEM Looking for Promotion ET Second Vertex > 45 GeV # of Events = 3,464 RCES = 181.15 cm DZ DZ = Vertex 1 (Right Vertex) Pre-Selection Cuts Photon Et > 30 GeV, Missing Et > 30 GeV, Vertex w/ NTracks >= 3, |T0|< 5 ns, |Z0|< 60 cm, and SPt> 5 GeV, Df(mstub, electron) > 30 degrees & CES Energy > 10 GeV, Less than 2 Plug Hadronic Towers and 8 Central EM Towers w/ hits in the same wedge as electron, PMT Asymmetry < 0.6 = Vertex 2 (Second Vertex) Mean: -0.0536 RMS: 1.99 Signal Region = 523 Events #of Events w/ 2 ns < tcorr < 7 ns Control Region = 557 Events #of Events w/ -7 ns < tcorr < -2 ns 2nd Vertex w/ NTracks >= 3, |T0|< 5 ns, |Z0|< 60 cm, and SPt> 5 GeV
Looking for Promotion Effect CES Energy Read Out By The CEM Looking for Promotion ET Second Vertex > 45 GeV & First Vertex < 45 GeV # of Events = 249 RCES = 181.15 cm DZ DZ = Vertex 1 (Right Vertex) Pre-Selection Cuts Photon Et > 30 GeV, Missing Et > 30 GeV, Vertex w/ NTracks >= 3, |T0|< 5 ns, |Z0|< 60 cm, and SPt> 5 GeV, Df(mstub, electron) > 30 degrees & CES Energy > 10 GeV, Less than 2 Plug Hadronic Towers and 8 Central EM Towers w/ hits in the same wedge as electron, PMT Asymmetry < 0.6 = Vertex 2 (Second Vertex) Mean: -0.0554 RMS: 1.958 Signal Region = 38 Events #of Events w/ 2 ns < tcorr < 7 ns Control Region = 41 Events #of Events w/ -7 ns < tcorr < -2 ns 2nd Vertex w/ NTracks >= 3, |T0|< 5 ns, |Z0|< 60 cm, and SPt> 5 GeV
Looking for Promotion Effect CES Energy Read Out By The CEM Looking for Promotion ET Second Vertex > 45 GeV & First Vertex > 45 GeV # of Events = 3,215 RCES = 181.15 cm DZ DZ = Vertex 1 (Right Vertex) Pre-Selection Cuts Photon Et > 30 GeV, Missing Et > 30 GeV, Vertex w/ NTracks >= 3, |T0|< 5 ns, |Z0|< 60 cm, and SPt> 5 GeV, Df(mstub, electron) > 30 degrees & CES Energy > 10 GeV, Less than 2 Plug Hadronic Towers and 8 Central EM Towers w/ hits in the same wedge as electron, PMT Asymmetry < 0.6 = Vertex 2 (Second Vertex) Mean: -0.0534 RMS: 1.993 Signal Region = 485 Events #of Events w/ 2 ns < tcorr < 7 ns Control Region = 516 Events #of Events w/ -7 ns < tcorr < -2 ns 2nd Vertex w/ NTracks >= 3, |T0|< 5 ns, |Z0|< 60 cm, and SPt> 5 GeV
Looking for Promotion Effect CES Energy Read Out By The CEM Looking for Promotion ET Second Vertex < 45 GeV & First Vertex > 45 GeV # of Events = 186 RCES = 181.15 cm DZ DZ = Vertex 1 (Right Vertex) Pre-Selection Cuts Photon Et > 30 GeV, Missing Et > 30 GeV, Vertex w/ NTracks >= 3, |T0|< 5 ns, |Z0|< 60 cm, and SPt> 5 GeV, Df(mstub, electron) > 30 degrees & CES Energy > 10 GeV, Less than 2 Plug Hadronic Towers and 8 Central EM Towers w/ hits in the same wedge as electron, PMT Asymmetry < 0.6 = Vertex 2 (Second Vertex) Mean: -0.101 RMS: 2.086 Signal Region = 30 Events #of Events w/ 2 ns < tcorr < 7 ns Control Region = 35 Events #of Events w/ -7 ns < tcorr < -2 ns 2nd Vertex w/ NTracks >= 3, |T0|< 5 ns, |Z0|< 60 cm, and SPt> 5 GeV
Looking for Promotion Effect I don’t see the promotion effect Adam saw in MC ETmeas > 45 GeV Mean: -0.0536 RMS: 1.99 ETmeas > 45 GeV && ETtrue < 45 GeV Mean: -0.0554 RMS: 1.958 ETmeas > 45 GeV && ETtrue > 45 GeV Mean: -0.0534 RMS: 1.993 ETmeas < 45 GeV && ETtrue > 45 GeV Mean: -0.101 RMS: 2.086
Event Selection Flow Diagram CES Energy Read Out By The CEM RCES = 181.15 cm Right Vertex Pre-Sample Events w/ a second Vertex # of Events = 14,667 DZ DZ Et Right Vertex > 45 GeV Et Second Vertex > 45 GeV Right Vertex Pre-Sample Events w/ a second Vertex 45 GeV / 45 GeV # of Events = Et Right Vertex > 30 GeV Et Right Vertex > 30 GeV Et Right Vertex > 45 GeV Et Second Vertex > 30 GeV Et Second Vertex > 45 GeV Et Second Vertex > 30 GeV Right Vertex Pre-Sample Events w/ a second Vertex 30 GeV / 30 GeV # of Events = Right Vertex Pre-Sample Events w/ a second Vertex 30 GeV / 45 GeV # of Events = Right Vertex Pre-Sample Events w/ a second Vertex 45 GeV / 30 GeV # of Events = = Vertex 1 (Right Vertex) = Vertex 2 (Second Vertex)
Event Selection Summary Look at the timing information for these scenarios
CES Energy Read Out By The CEM Right Vertex Pre-Sample Events w/ a second Vertex 30 GeV / 30 GeV # of Events = 14,497 Zces Zces Electron Et Right Vertex > 30 GeV Electron Et Second Vertex > 30 GeV = Vertex 1 (Right Vertex) = Vertex 2 (Second Vertex) Signal Region = 68 Events Number of Events w/ 2 ns < tcorr < 7 ns Control Region = 69 Events Number of Events w/ -7 ns < tcorr < -2 ns Signal Region = 2315 Events Number of Events w/ 2 ns < tcorr < 7 ns Control Region = 2202 Events Number of Events w/ -7 ns < tcorr < -2 ns
CES Energy Read Out By The CEM Right Vertex Pre-Sample Events w/ a second Vertex 30 GeV / 45 GeV # of Events = 3,401 Electron Et Right Vertex > 30 GeV Zces Zces = Vertex 1 (Right Vertex) Electron Et Second Vertex > 45 GeV = Vertex 2 (Second Vertex) Signal Region = 11 Events Number of Events w/ 2 ns < tcorr < 7 ns Control Region = 18 Events Number of Events w/ -7 ns < tcorr < -2 ns Signal Region = 515 Events Number of Events w/ 2 ns < tcorr < 7 ns Control Region = 551 Events Number of Events w/ -7 ns < tcorr < -2 ns
CES Energy Read Out By The CEM Right Vertex Pre-Sample Events w/ a second Vertex 45 GeV / 30 GeV # of Events = 3,464 Zces Zces Electron Et Right Vertex > 45 GeV = Vertex 1 (Right Vertex) Electron Et Second Vertex > 30 GeV = Vertex 2 (Second Vertex) Signal Region = 12 Events Number of Events w/ 2 ns < tcorr < 7 ns Control Region = 19 Events Number of Events w/ -7 ns < tcorr < -2 ns Signal Region = 523 Events Number of Events w/ 2 ns < tcorr < 7 ns Control Region = 557 Events Number of Events w/ -7 ns < tcorr < -2 ns
CES Energy Read Out By The CEM Right Vertex Pre-Sample Events w/ a second Vertex 45 GeV / 45 GeV # of Events = 3,464 Zces Zces Electron Et Right Vertex > 45 GeV = Vertex 1 (Right Vertex) Electron Et Second Vertex > 45 GeV = Vertex 2 (Second Vertex) Signal Region = 12 Events Number of Events w/ 2 ns < tcorr < 7 ns Control Region = 19 Events Number of Events w/ -7 ns < tcorr < -2 ns Signal Region = 523 Events Number of Events w/ 2 ns < tcorr < 7 ns Control Region = 557 Events Number of Events w/ -7 ns < tcorr < -2 ns
Promotion Effect Summary I don’t see the promotion effect Adam saw in MC