Download
1 / 48
510 likes | 882 Views
Descriptive Epidemiology & Routine Analyses: Summarizing Data by Groups/Type/Location. Monica Huang Council of State and Territorial Epidemiologists. Next Step: Descriptive Analysis. Reports are full of descriptive analysis – stratification by age groups, sex, underlying conditions, location

E N D
Descriptive Epidemiology & Routine Analyses: Summarizing Data by Groups/Type/Location Monica Huang Council of State and Territorial Epidemiologists
Next Step: Descriptive Analysis • Reports are full of descriptive analysis – stratification by age groups, sex, underlying conditions, location • Now you’ve figured out how to manage your data, it’s standardized, you have your forms set and the information you’re collecting. What do you do with it? • This is data for action! The data should be put to use, and the most straightforward use of the data is descriptive epidemiology • Questions: What types of analyses will be most important in your country? What are the best ways to use your surveillance data? What was the purpose in collecting all of this data?
Objectives of Descriptive Epidemiology • Evaluate trends in health and disease • Frequency and distribution of disease • Comparisons between subgroups, regions, etc. • Provide information for planning, policy development • Identify problems to be studied in greater detail (example: correlations between a risk factor and an increased outcome)
Elements of Descriptive Epidemiology • Time • Do disease patterns differ based on the time of year? • Seasonality • Person • Do disease patterns differ based on person’s age or sex? • Are certain groups of people more susceptible to complications of disease? • Place • Do disease patterns differ based on geographic location? • Combinations of Time, Place and Person • E.g. age groups over time, stratified by location, etc.
Time • Temperate climates usually have flu season during the fall/winter months • Tropical climates have a less predictable flu season (e.g. may have several peaks throughout the season, and they may vary dramatically among regions of a country) • Differences in patterns are important • Temporal patterns are often different during an epidemic or pandemic
Percentage of Visits for Influenza-like Illness (ILI) Reported by the U.S. Outpatient Influenza-like Illness Surveillance Network (ILINet),National Summary October 1, 2006 – September 24, 2011
Influenza Positive Tests Reported to CDC by U.S. WHO/NREVSS Collaborating Laboratories, National Summary, 2007-08 through 2010-11 Number of Positive Specimens PercentPositive
Person • Do certain characteristics make a person more susceptible to infection or complications due to infection? • Demographic data • Age and gender • Underlying conditions • Neurologic disorders, pulmonary disease, genetic disorders, cardiac disease, immunosuppressive condition, endocrine disorders, mitochondrial disorders, renal disease, obesity, and pregnancy
Standard Age Stratifications • Optional stratifications: • Additional age categories that inform vaccine policies: • 0 – 12 or 12 – 24 months • May also combine age groups, if data is too sparse to break into larger groups • Other relevant groups for pre-determined analyses • 0 to < 2 years • 2 to < 5 years • 5 to < 15 years • 15 to < 49 years • 50 to < 65 years • ≥ 65 years
Peak Percent of Patient Visits Due to ILI by Season and Age Group, 1998-2010
Percentage of Visits for ILI Reported by U.S. Outpatient Influenza-like Illness Surveillance Network (ILINet)National Summary 2000-01 through 2009-10 by Age Group Data as of week ending 20 February, 2010
Age-level comparison of percent positive over 10 influenza seasons
Influenza A(H3N2) predominant and non- predominant seasons, individuals aged >64
Standard Underlying Conditions • Chronic respiratory disease • Asthma • Diabetes • Chronic cardiac disease • Chronic liver disease • Chronic renal disease • Chronic neurological or neuromuscular disease • Immunodeficiency
Place: Are things different or worse in one area vs. another? • Visualization of place information can be in • Maps • Graphs • Tables • Place can be defined in different ways depending on what the question is you are asking and available information • Geographic levels: region, state, county, city, or site
Summary Table • *HHS regions (Region 1 CT, ME, MA, NH, RI, VT; Region 2: NJ, NY, Puerto Rico, U.S. Virgin Islands; Region 3: DE, DC, MD, PA, VA, WV; Region 4: AL, FL, GA, KY, MS, NC, SC, TN; Region 5: IL, IN, MI, MN, OH, WI; Region 6: AR, LA, NM, OK, TX; Region 7: IA, KS, MO, NE; Region 8: CO, MT, ND, SD, UT, WY; Region 9: AZ, CA, Guam, HI, NV; and Region 10: AK, ID, OR, WA). • † Elevated means the % of visits for ILI is at or above the national or region-specific baseline. • ‡ National data are for current week; regional data are for the most recent three weeks. • § Includes all 50 states, the District of Columbia, Guam, Puerto Rico, and the U.S. Virgin Islands.
Important Considerations • When summarizing data by place, you need a way to correctly compare information, which includes correcting for confounders (variables or elements that influence the outcome but are not equal among groups) • There may be differences in the way that sites report (ex. a pediatrician will always report higher proportion of ILI than a practice that also sees adults) • There are ways that you can correct for these differences if they exist, but they require more advanced statistical methods, including: • Baselines (discussed later) • Data weighting
Data Display • As part of CDC’s weekly report we have deployed a web tool that allows users to look at differences in circulating viruses and the intensity of activity both by geographic region and time period • Link: http://gis.cdc.gov/grasp/fluview/fluportaldashboard.html
Methods of Analysis Matter • Different types of analyses lead to different messages: • Counts: easy to obtain; can be misleading • Proportions: simple, clear, efficient analysis • Using an appropriate denominator (population, total visits, total specimens) makes data easier to interpret • Incidence rates: proportion of persons in a population who are sick during a specified period of time • Risk ratios or odds ratios provide a better understanding of the importance of the risk factor
Example: Incidence Rates • In a study of 2390 women between 16 and 49 years of age admitted to hospital for SARI, it was found that 482 were influenza positive in a one year period 482 / (2390 / 100,000) = 20,167 Therefore, there are influenza positive 20,167 per 100,000 women admitted to hospital in a one year period
Rates Commonly Used in Epidemiology • Crude • For total population, not adjusted to reflect contributions of different age groups to total (e.g. annual cancer mortality rate) • Category specific • Based on the number of persons in the category and the number of cases in that group (e.g. age-specific cancer mortality rate) • Age adjusted • More appropriate comparisons when differences in age distribution may mask real differences in the condition of interest
Importance of Denominators ------- total number of visits -------counts of ILI Burkom et al. 2008
Conclusions • You can learn a lot by looking at differences in disease in terms of simple descriptives • What are the normal patterns of disease? • Disease patterns will often differ based on differences in person and place • Changes in normal patterns occur during major epidemics or pandemics • Your methods of analysis make a big difference in interpretation
Overview • Descriptive epidemiology aims to evaluate trends and allow comparisons by region and within subgroups • Provides a basis for planning, policy making, etc. • Helps to identify problems to be studied further • Data can be conveyed and compared easily using simple graphs • Influenza activity • Risk groups • Age groups • Weekly trends • Circulating viruses
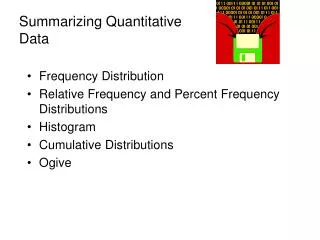
Types of Graphs Pie charts Bar charts Line graphs
Objectives - Use Excel to: • Sort data • Calculate: • Sum • Sum total cases, total specimens tested, positive, etc. • Percentage/proportion • Provides better picture of how widespread • Important to collect denominators in order to calculate! • Rates • Gives idea of frequency in population, population level estimate of illness • Stratify cases by population groups, time, type of virus, etc.
Learning Objectives • Use Excel to produce simple graphs illustrating: • Counts • Proportions (must have denominator data!) • Rates (where population denominator data is available) • Activity over time • Activity among different population groups • Keep track of site usage/performance – number of samples collected by site by month; number of SARI cases enrolled; consistency of reporting over time
Sorting Data • Sorting data is a simple way to group like elements together, allowing for more simple construction of graphics • Can sort data on a single variable, or create a sort based on several levels of data
Sorting Data • Data sorted by: • Site name • Date of Onset • Sex
Creating Tables • A well designed table is a good way to get a quick look at your data, sorted or summarized by whichever variables you choose • Sorting your tables prior to data cleaning can also be useful • Example: Sorting by date might show that cases have been recorded as occurring before surveillance was begun • Summing data by site might help evaluate site performance • Example: Summing by number of specimens submitted by site might help to understand whether sites are meeting quotas
Pivot Tables/Charts • Using pivot tables to create tables, charts, and graphs helps to summarize and display data in a custom format • A very easy, effective way to summarize data and create charts
Pivot Tables/Charts • Set up in the exact same way in Access; can be used easily in either program
Pivot Tables/Charts • Drag and drop fields in any order
Pivot Tables/Charts • Drag and drop fields • Use table to make charts easily
Summary • With well-cleaned and organized data, simple tools are available for custom presentations and easy analysis • Making use of these simple tools makes the job of the analyst, reporter, data manager much easier • Messages can be conveyed easily using graphics produced in a straightforward manner Exercise • Produce a table showing number of specimens submitted with test results, stratified by site • Produce a line graph of SARI admissions by site, over time