Download
1 / 26
370 likes | 982 Views
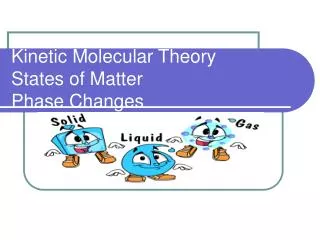
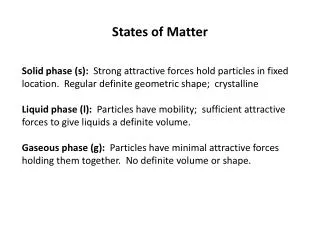
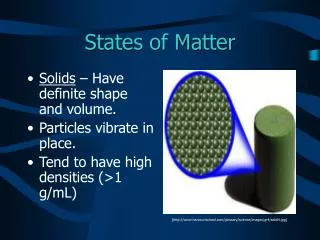
States of Matter Phase Change. Hill Science 6 Mixtures and Solutions. Phase Change Diagram. Water. Water exists on our planet in three states. Ice, water, and water vapor What causes water to be in one phase or another?. ENERGY. ENERGY.

E N D
States of Matter Phase Change Hill Science 6 Mixtures and Solutions
Water • Water exists on our planet in three states. • Ice, water, and water vapor • What causes water to be in one phase or another?
ENERGY • When energy is added to a substance that energy causes the particles in the substance to move faster and farther apart. • What happens to the particles when energy is taken away from a substance?
Phase Change • Energy content is responsible for the different phases of matter. • Matter can be made to change phase when energy is added to or taken away from a substance. ENERGY
Block of Ice to Steam • Block of Ice to Water Vapor
Melting- Solid to Liquid • Melting is the changing of a solid to a liquid when the substance absorbs heat energy. • Melting Point • Water 0° C. • Table salt 801° C. • Diamond 3700° C.
Freezing- Liquid to Solid • Opposite of melting: liquid changing to a solid is freezing. • Freezing occurs when a substance loses heat energy. • The freezing point of a substance is equal to the melting point!
Vaporization- Liquid to Gas • Vaporization is the changing of a liquid to a gas when the substance absorbs heat energy. • Vaporization occurring at the surface of a liquid is called evaporation.
Evaporation- a Cooling Process • As water in the perspiration evaporates from your skin it absorbs and carries away heat energy from your body.
Boiling • If enough heat energy is applied to a substance particles inside the liquid can change to gas. • These particles travel to the surface of the liquid and then into the air. This process is called boiling.
Boiling Point • Boiling Point – temperature at which a substance boils. • Water 100° C. • Table salt 1413° C. • Diamond 4200° C. • What is the difference between evaporation and boiling?
Condensation- Gas to Liquid • Gases can change phase, also in a gas to liquid phase change. • A substance in the gas phase that loses heat will change to a liquid. This is called condensation.
Condensation • Water vapor in surrounding air loses heat energy when it comes in contact with the cold glass. Water vapor condenses and becomes liquid drops of water.
Sublimation – Solid to Gas • Solid to gas phase change occurs when the surface particles of a solid change directly into a gas.
Sublimation – Solid to Gas • You may notice this in the cold winter with snow. The snow does not melt, but slowly disappears. • Dry ice goes directly from solid carbon dioxide to gas.
Phase Change • Phase Change Diagram in Water
Temperature Comparisons • Boiling Point of H2O 212 F 100 C • Melting Point of H2O 32 F 0 C • Freezing Point of H2O 32 F 0 C