Download
1 / 15
150 likes | 232 Views
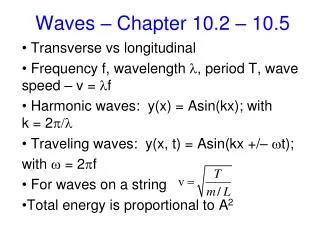
This study focuses on X-ray mapping analysis of an Al-Ni alloy, examining the distribution and concentration of Fe in 50µm samples. The results are presented in Figures 10.17 to 10.26, showcasing the presence of Fe peaks and the composition of Al, Fe, and Ni in various samples with different thicknesses and compositions. Detailed insights are provided on the elemental distribution and structural characteristics of the alloy, highlighting the significance of Fe content in the overall composition.

E N D
Chapter 10.5 X-ray Mapping
Al Ni 50 m Figure 10.17
Fe Al Ni 50 m Figure 10.18(a)
NiL AlK NiKa No Fe peaks! NiKb NiL AlK NiKa FeKa NiKb FeKb Fe AlK No Fe peaks! AlKsum NiKa Figure 10.18(b)
50 mm Figure 10.19
(c/s) 2 1 (c/s) Figure 10.20(a)
60% DT (Al) Al Fe Ni 80% DT (Al) 20 m Figure 10.20(b)
20 m Figure 10.21
50 mm AlFeNi Figure 10.22(a)
AlNi AlFe FeNi 50 mm Figure 10.22(b)
AlNi AlFe FeNi AlFeNi 50 mm Figure 10.22(c)
50 mm Figure 10.23
20 m Figure 10.24
20 m 0% 10% Figure 10.25
c 50 mm Figure 10.26