Download
1 / 1
10 likes | 124 Views
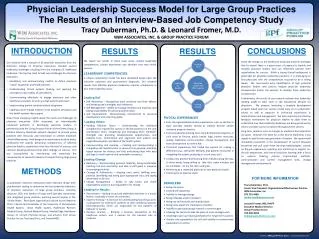
The PAIN OUT registry is an international initiative aimed at improving post-surgical pain management through standardized practices. This preliminary data highlights that 65% of surveyed patients received information on pain treatment options, with 76% having their pain assessed post-surgery. Notably, 71% of patients reporting severe pain received opioid treatment. Despite adherence to recommended guidelines, patient-reported outcomes show no significant improvements in pain experiences. Further investigations are essential to bridge this gap. The initiative encourages participation from hospitals worldwide.

E N D
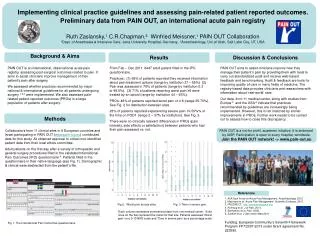
Implementing clinical practice guidelines and assessing pain-related patient reported outcomes. Preliminary data from PAIN OUT, an international acute pain registry Ruth Zaslansky,¹ C.R.Chapman,² Winfried Meissner,¹ PAIN OUT Collaboration ¹Dept. of Anesthesia & Intensive Care, Jena University Hospital, Germany; ²Anesthesiology, Uni of Utah, Salt Lake City, UT, USA Background & Aims Results Discussion & Conclusions PAIN OUT is an international, observational acute pain registry, assessing post-surgical outcomes related to pain. It aims to assist clinicians improve management of their patient’s pain after surgery. We assessed whether practices recommended by major national & international guidelines for all patients undergoing surgery 1,2,3 were implemented. We also assessed pain-related patient-reported outcomes (PROs) in a large population of patients after surgery. From Feb – Dec 2011, 6447 adult patient filled in the IPO questionnaire. Practices: (1) 65% of patients reported they received information about pain treatment options (range by institution 27 – 85%) (2) Pain was assessed in 76% of patients (range by institution 0.3 to 99.8%). (3) 71% of patients reporting worst pain ≥6 were treated by an opioid (range by institution 44 – 93%). PROs: 48% of patients reported worst pain of ≥ 6 (range 25-70%). See Fig. 2 for distribution between sites. 23% of patients reported experiencing severe pain 10-50%% of the time on POD1 (range 2 – 37% by institution). See Fig. 3. There were no clinically relevant differences in PROs (pain intensity, side effects or satisfaction) between patients who had their pain assessed vs. not. PAIN OUT aims to assist clinicians improve how they manage their patient’s pain by providing them with tools to carry out standardized audit and receive web-based feedback and benchmarking. Audit & feedback are tools for improving quality of care in many fields of medicine. The registry-based data provides clinicians and researchers with information about ’real-world’ care. Our data, from 11 medical center, along with studies from Europe 5 and the USA 6 indicate that practices recommended by guidelines are increasingly being implemented. However, this is not matched by similar improvements in PROs. Further work needs to be carried out to assess how to close this discrepancy. Methods Collaborators from 11 clinical sites in 8 European countries and Israel participating in PAIN OUT (www.pain-out.eu) contributed data for this study. All obtained approval to collect non-identified patient data from their local ethics committee. Adult patients on the first day after a variety of orthopaedic and general surgery procedures filled in the validated International Pain Outcomes (IPO) questionnaire.4 Patients filled in the questionnaire in their native language (see Fig. 1). Demographic & clinical were abstracted from the patient’s file. PAIN OUT is a not-for profit, academic initiative. It is endorsed by IASP. Participation is open to every hospital, worldwide.Join the PAIN OUT network! -> www.pain-out.eu References 1. ASA Task Force on Acute Pain Management. Anesthesiology, 2012. 2. Macintyre et al Acute Pain Management: Scientific Evidence, 2010. 3. PROSPECT, http://www.postoppain.org 4. Rothaug et al. J of Pain, 2013. 5. Benhamou et al. Pain, 2008. 6. Zubkoff et al. J Gen Intern Med 2010 Fig 2. Worst pain across sites. Fig. 3 Time in severe pain. Each column represents summarized data from one medical center. Solid lines on the bar represent the mean for that site. Patients assessed ‘Worst pain’ on a 0-10 NRS scale and ‘Time in severe pain’ as a percentage scale. Funding: European Community’s Seventh Framework Program FP7/2007-2013 under Grant agreement No. 223590. Fig 1. The International Pain Outcomes questionnaire