Patients (%)
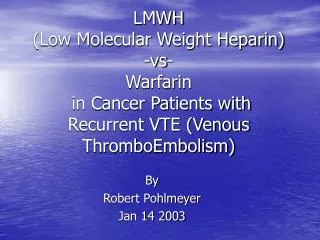
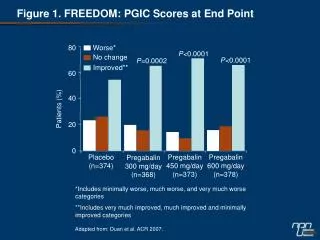
Figure 1. FREEDOM: PGIC Scores at End Point. 80. Worse*. P < 0.0001. No change. P < 0.0001. P= 0.0002. Improved**. 60. 40. Patients (%). 20. 0. Placebo (n=374). Pregabalin 450 mg/day (n=373). Pregabalin 600 mg/day (n=378). Pregabalin 300 mg/day (n=368).

Patients (%)
E N D
Presentation Transcript
Figure 1. FREEDOM: PGIC Scores at End Point 80 Worse* P<0.0001 No change P<0.0001 P=0.0002 Improved** 60 40 Patients (%) 20 0 Placebo (n=374) Pregabalin 450 mg/day (n=373) Pregabalin 600 mg/day (n=378) Pregabalin 300 mg/day (n=368) *Includes minimally worse, much worse, and very much worse categories **Includes very much improved, much improved and minimally improved categories Adapted from: Duan et al. ACR 2007.
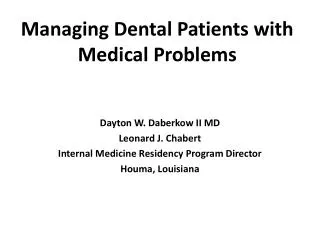
Figure 2. Duration of Treatment at One Year 180 n=172 160 140 n=114 120 100 80 Number of pregabalin patients n=56 60 n=46 40 n=18 n=17 20 n=6 0 ≤ 1 2-14 15-28 29-90 91-180 181-364 ≥365 Duration (days) Adapted from: Florian et al. ACR 2007.