Download
1 / 22
230 likes | 380 Views
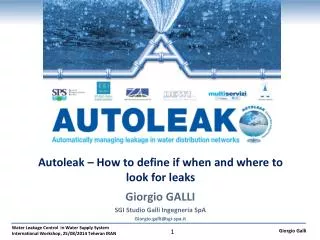
Autoleak – How to define if when and where to look for leaks. Giorgio GALLI SGI Studio Galli Ingegneria SpA Giorgio.galli@sgi-spa.it. Project Information. Cofinaced by EU and Ministry of Environment Duration: 3 years (ended in 2011) Budget: EUR 1.400.000,00

E N D
Autoleak – How to define if when and where to look for leaks Giorgio GALLI SGI Studio Galli Ingegneria SpA Giorgio.galli@sgi-spa.it
Project Information • Cofinaced by EU and Ministry of Environment • Duration: 3 years (ended in 2011) • Budget: EUR 1.400.000,00 • 2 Pilot sites: Ancona (Italy), Nicosia (Cyprus) • 6 partners (4 engineering consultants + 2 water utilities)
Leakage Control System is Widely Known: so why is leakage so high ? • Lack of priority for leakage • Insufficient Staff • Time consuming analysis • Effort directed to emergencies
Daily Step by Step Leakage Analysis • Extract minimum night flow • Subtract Customer Consumption • Quantify Leakage • Assess if leakage increasing • Decide if worthwhile to locate and repair leaks The Solution isAutomate the process
Autoleak Features Automatically for every DMA AUTOLEAK • Determines current recoverable leakage • Extrapolates rate of rise from historical data • Quantifies value of predicted lost water (Benefit) • Compares with cost of intervention • Decide if worthwhile to intervene
AUTOLEAK – Operative Principle Intervention if V > X
AUTOLEAK Structure AREA DMA Flow - Bulk Flow Meters - Variable time step Pressure - Pressure inlet - Variable time step AMR - Users consumption - Hourly, daily Noise Log - Leak Probability Hystorical Intervention Intervention Cost Historical Consumption Production and retail Cost Import Manager (Imports monitoring data) Geodatabase – GIS Leakage and Intervention Database Quality control of data Leak location module Leak repairs module New Minimum? YES Leakage calculation Estimation of Water Recovered Estimation of Intervention Cost Leakage Detection (Noise Loggers) COST-BENEFIT ANALYSIS Intervention (YES)
Calculation of Cost of Intervention • Average Recovered Flow per Leak • Calculation of number of leaks to be repaired • Average Intervention Cost (leakage detection + repair) Historical Intervention NO YES Real Data from DMA Parametric data from similar case studies
Historical Cost of Intervention • Real Data from past interventions • Calculation of Cost and Water Recovery of past leakage intervention • Cost Estimation of future intervention based on the expected water recovery
Assessment of economic convenience • Total value of the recovery (V) • Estimated cost of intervention (X) • if V>X, the intervention will be worthwhile • Priority = (V-X)/km
Leak Repair Report • Leak repair report • Make records of your leak repairs • Provide your staff with site forms to record data • Create statistics of your leak repairs • Create Leakage Maps
Ancona Pilot Area (Multiservizi SpA - Italy) Mean Pressure: 55 m Reservoir Level: 140 m Min. Ground Level: 56,9 m Max. Ground Level: 74 m Water mains length: 1,9 Km Number of consumer meters: 325 Qin
PILOT AREA 3D VIEW PILOT AREA
Ancona Pilot Area AMR – ConnectedDevices Noise Loggers Bulk Meter Collector Users’ Meters
Access Point AUTOLEAK Application - Real Case Example FTP server Internet Connection User Interface Real time leakage calculation Leak Alarm from noise loggers AMR Radio 868MHz
Nicosia Pilot Area (WBN- Cyprus) • Mean Pressure: 17.5 m • Reservoir Level: 349 m • Min. Ground Level: 320 m • Max. Ground Level: 338 m • Water mainslength: 3.5 Km • Mains Material: AC • Numberof consumer meters: 86 • Numberof bulk meters: 4 (2 inlets and 2 outlets)
Description of the system installed-Installation of Concentrator Self Powered Concentrator (Wind & Solar) Concentrator IP 68 BOX Concentrator
Lesson Learned and possible development • AMR Transmission problems in Ancona (then solved) • Initial setup and customization necessary for each pilot application • AMR repeaters mount on light pole, authorization needed • Technology Improvement • Next development in data transmission (electricity, ADSL, cable? ….) • Full Automatic Correlation
Conclusions - Advantages of Autoleak • Interfaces with all currently available technology including AMR • Data Integration • Makes managing leakage almost fully automatic • Allows to save investment focusing on interventions where the expected benefit is greater www.autoleak.eu