Download

1 / 22
240 likes | 439 Views
Electrospray and Atmospheric Pressure Chemical Ionization Quadrupole MS for Small Molecules. Jonathan A. Karty, Ph.D. LC-MS Picture. General Sample Guidelines. Purify analyte if possible Analyte should be 1-100 mg/L in concentration Colored samples should be translucent

E N D
Electrospray and Atmospheric Pressure Chemical Ionization Quadrupole MS for Small Molecules Jonathan A. Karty, Ph.D.
General Sample Guidelines • Purify analyte if possible • Analyte should be 1-100 mg/L in concentration • Colored samples should be translucent • Sample must have no particulates or precipitates • Use only volatile solvents/buffers • MeOH, H2O, acetone, CH3CN, THF, CHCl3, etc. • HOAc, HCOOH, NH4OAc, NH3, etc. (weak, volatile) • Ionic strength < 20 mM is best (e.g. 0.1% v/v HOAc) • 1 – 5 μM NaOAc for acid/base labile samples • Need at least 50 µL for loop injection • If you need non-polar solvent for APCI, see Dr. Karty first
Agilent 6130 System Description • Inlet is an Agilent 1200 HPLC System • Binary gradient (4 solvent bottles, only 2 can be used in an analysis (A1 or A2 with B1 or B2, not A1 and A2) • 50-2,500 uL/min flow rates • Autosampler 0.5-100 μL injection volume • 6-column selection valve (loop or 1 of 5 HPLC columns) • C18 reversed phase is default column (H2O-CH3OH solvents) • Agilent 1200 DAD detector • 190-800 nm UV-VIS detector • Can record entire UV-VIS spectrum throughout a run • Electrospray Ionization-Atmospheric Pressure Chemical Ionization/Quadrupole (ESI/APCI-Q) mass spectrometer • 50 – 3,000 m/z range • Can make ions by ESI, APCI, or both • Can alternate positive and negative ion modes during a run
Air Sensitive MS • Source on 6130 MS is flushed constantly with nitrogen from a dewar • Enables walk-up air senstive ESI/APCI MS • A syringe pump with air-tight “Sample-Lock” syringe can be used for air-sensitive analyses • Requires special training from Dr. Karty • A separate syringe is needed for each sample • A “dummy” sample must still be placed in the autosampler • Remember to keep concentrations around 20 mg/L • Colored solutions should be translucent
HPLC-MS vs. Loop Injection • MSF uses the 1200 autosampler for nearly all samples • Must inject something, even if syringe pump is used • Sample can go through an empty loop • Solution must contain only sample and volatile components • Allows 2.5 minute analysis time • Sample can also be separated by HPLC • Up to 5 columns are available • Currently only C18 reversed phase available for general use
Electrospray Ionization (ESI) • Dilute solution of analyte (1 mg/L) infused through a fine needle in a high electric field • Very small, highly charged droplets are created • Solvent evaporates, droplets split and/or ions ejected to lower charge/area ratio • Warm nebulizing gas accelerates drying • Basic sites are eventually protonated (M+H)+ • Ketones, esters, and alcohols can sodiate (M+Na)+ • Free ions are directed into the vacuum chamber
ESI Picture http://newobjective.com/images/electro/spraytip_bw.jpg
Advantages of ESI • Gentle ionization process • High chance of observing intact molecular ion • Very labile analytes can be ionized • Non-covalent complexes can be studied by ESI • Molecule need not be volatile • Proteins/peptides easily analyzed by ESI • Salts can be analyzed by ESI • Easily coupled with HPLC • Both positive and negative ions can be generated by the same source
Characteristics of ESI Ions • ESI is a thermal process (1 atm in source) • Little fragmentation due to ionization (cf EI) • Solution-phase ions are often preserved • e.g. organometallic salts • ESI ions are generated by ion transfer • (M+H)+, (M+Na)+, or (M-H)-, rarely M+• or M-• • ESI often generates multiply charged ions • (M+2H)2+ or (M+10H)10+ • Most ions are 500-1500 m/z • ESI spectrum x-axis must be mass/charge (m/z or Th, not amu or Da)
ESI Disadvantages • Analyte must have an acidic or basic site • Hydrocarbons and steroids not readily ionized by ESI • Analyte must be soluble in polar, volatile solvent • ESI is less efficient than other sources • Most ions don’t make it into the vacuum system • ESI is very sensitive to contaminants • Solvent clusters can dominate spectra • Distribution of multiple charge states can make spectra of mixtures hard to interpret • e.g. polymer mass spectra
What Samples Can Be Analyzed by ESI-QMS? • Non-volatile organic molecules • Should be soluble in polar, volatile solvents • Molecule must be ionizable (MS detects ions) • R-NH2, R-CO2H, R-HSO3, R-OH, R-H2PO3 work best for ESI • Aromatics, ketones, protected heteroatoms work well by APCI • Organometallic complexes • Organometallic salts work especially well • Source is flooded with N2 gas from a dewar • HPLC-MS • With appropriate mobile phases
What Samples Are Inappropriate for ESI-QMS analysis? • Samples in non-polar or non-volatile solvent: • Hexane, benzene, CH2Cl2, DMSO, etc. • Run these in APCI or mixed mode • Buffer systems incompatible with ESI • 6M urea, 10% glycerol, 0.1 M NaH2PO4, TBAF, (involatile) • Strong acid solutions (too conductive) • detergents • Molecules that have no ionizable groups
ESI Example 22% 78%
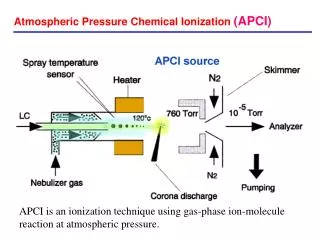
Atmospheric Pressure Chemical Ionization (APCI) • APCI uses a corona discharge to generate acidic solvent cations from a vapor • Ionizing reagent often CHCl3+ or CH3OH+ • These solvent cations can protonate hydrophobic species not amenable to ESI • APCI can be done from hexane or THF • Often used to study lipids and steroids • In MSF, completely protected macrocycles are routinely studied by APCI • APCI is a little harsher than ESI • Labile molecules might fragment
APCI Diagram http://imaisd.usc.es/riaidt/masas/imagenes/apci1.jpg
Agilent 6130 Multi-mode Source http://www.chem.agilent.com/Library/Images1/MMS_schematic_300dpi_039393.jpg
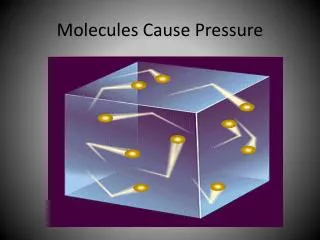
Cluster and Background Ions • The low m/z (<300) region of the mass spectrum is often dominated by solvent cluster ions • These are distinguished by low mass defects due to Na+ and K+ incorporation • Masses are XXX.0 or XXX.9 • Compounds from previous samples can coat the source leading to persistent “background” ions • e.g. 242.1 for tetrabutylammonium • Might see large ion from previous person’s run • To confirm an ion is “background” try injecting a blank of ESI solution with your solvent system
About the Fragmentor… • There is a region in the source where ion-nitrogen collisions can cause fragmentation • This occurs between the end of the heated capillary and the first skimmer cone • The voltage difference between capillary and skimmer is called the “Fragmentor” voltage • Fragmentor voltage has 2 postive main effects • It increases the number of ions that make it to the quad • It can knock non-covalent attached neutrals • However, a high fragmentor value can cause labile groups to dissociate • Phospho-diesters can be rather vulnerable to this
A Word About Quantification • LC-MS is a quantitative technique • Use only 1 m/z when quantifying a compound • Intensity is proportional to concentration • I α [X] • α is unique to each compound • The more two compounds differ chemically, the more careful one must be when comparing their intensities • Ideally a calibration curve is constructed using multiple solutions of pure analyte at varying concentrations
Hands-on Training • Training starts AFTER 11/7/10 • Groups of no more than three • One hour or so to complete • No charge for first session • After training, students must demonstrate competency by running their own samples prior to being granted after-hours access