Download
1 / 37
370 likes | 493 Views
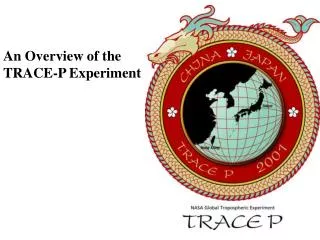
An Overview of the TRACE-P Experiment. NASA/GTE MISSIONS, 1983-2001. TRAnsport and Chemical Evolution over the Pacific (TRACE-P) A two-aircraft GTE mission over the western Pacific in February-April 2001. MISSION OBJECTIVES

E N D
An Overview of the TRACE-P Experiment
TRAnsport and Chemical Evolution over the Pacific (TRACE-P)A two-aircraft GTE mission over the western Pacific in February-April 2001 MISSION OBJECTIVES • to determine the chemical composition of the Asian outflow over the western Pacific in spring in order to understand and quantify the export of chemically and radiatively important gases and aerosols, and their precursors, from the Asian continent. • to determine the chemical evolution of the Asian outflow over the western Pacific in spring and to understand the ensemble of processes that control this evolution.
WHY TRACE-P? • Energy use in eastern Asia is expected to grow by 5% yr-1 until at least 2015: global implications for greenhouse gases, aerosols, OH, air quality • We need to observe the time-dependent impact on atmospheric composition. • Little is known of the emissions, export, and chemical aging of pollution from eastern Asia • Features of Asian outflow include active photochemistry (low latitudes), heterogeneous chemistry (dust, sulfur), complex aerosol microphysics, stratospheric and European/American pollution influences,seasonal biomass burning. • Need to build on previous knowledge acquired in PEM missions • PEM missions were exploratory; focus of TRACE-P is on quantifying Asian outflow in relation to emissions and fluxes.
CHINESE EMISSIONS ARE GROWING – OR ARE THEY ??Latest report from China to Energy Information Administrationclaims a decrease of emissions after 1997! Verification of emission estimates through atmospheric observations is critical for development of international environmental policy
QUANTIFYING CHEMICAL EXPORT FLUXES FROM LARGE GEOPOLITICAL SOURCE REGIONS SATELLITE OBSERVATIONS Global and continuous but few species, low resolution Source/sink inventories 3-D CHEMICAL TRACER MODELS SURFACE OBSERVATIONS high resolution but spatially limited Assimilated meteorological data AIRCRAFT OBSERVATIONS High resolution, targeted flights but limited in time; critical snapshots for model testing Chemical and aerosol processes EXPORT FLUXES
Satellite data in near-real time: MOPITT TOMS SEAWIFS AVHRR LIS TRACE-P EXECUTION Stratospheric intrusions FLIGHT PLANNING Long-range transport from Europe, N. America, Africa 3D chemical model forecasts: - ECHAM - GEOS-CHEM - Iowa/Kyushu - Meso-NH -LaRC/U. Wisconsin ASIAN OUTFLOW Boundary layer chemical/aerosol processing DC-8 P-3 PACIFIC • Emissions • Fossil fuel • Biomass burning • Biosphere, dust ASIA PACIFIC
INTEGRATION OF SATELLITE DATA AND CTMs INTO TRACE-P PLANNING AND EXECUTION • PRE-MISSION EMISSION INVENTORY DEVELOPMENT: provide the best a priori information for mission planning. • PRE-MISSION WORKSHOP (coordinated with ACE-Asia): use analyses of satellite data, 3D CTMs for spring 1994 and 2000 to identify major outflow patterns and develop menu of flights. • SUPPORT DURING MISSION EXECUTION: use near-real-time satellite data and CTM forecasts (in addition to meteorological forecasts) for day-to-day flight planning
EMISSION INVENTORIES PREPARED FOR TRACE-P PERIOD PROVIDED A PRIORI INFORMATION FOR CHEMICAL FORECASTS Source: D. Streets, Argonne National Lab CO Emissions (Fossil & Biofuel)
Near-real-time AVHRR fire count data were critical for TRACE-P flight planning March 4 March 7 March 13 Source: G.R. Carmichael, U. Iowa
TOMS observations of absorbing aerosols (March 8, 2001) Dustplume Biomass burning Biomass burning plume K.E. Pickering A.M. Thompson NASA/GSFC
TOMS aerosol forecast for March 10 K.E. Pickering, U. Maryland; A.M. Thompson, NASA/GSFC
TRACE-P DC-8 PAYLOAD Emphasis: high altitude, large-scale mapping, photochemistry
TRACE-P P-3 PAYLOAD Emphasis: low altitude, sulfur/aerosols, fluxes to ocean
INTERCOMPARISON FLIGHTS BETWEEN THE NASA DC-8 AND P-3B Sampling runs were conducted on 3 occasions (Guam, Japan, and Hawaii) resulting in a total of 2.5 hours of proximity flight. Level flight legs were conducted at altitudes of 500, 1000, 10000, and 18000 and 19000 feet Soundings were conducted between 500-10000 and 1000-18000 feet
TRACE-P COORDINATION WITH ACE-ASIA • Two joint Asian outflow chemical characterization flights between the TRACE-P P-3 and the ACE-Asia C-130 out of Japan including a Terra underpass on each flight. • One DIAL overpass of the ACE-Asia Twin Otter by the TRACE-P DC-8 during a column radiation closure experiment over the Sea of Japan
MOPITT near-real time data for CO columnsand validation experiments during TRACE-P Source: J.C. Gille, NCAR MOPITT validation spirals MOPITT validation transect (following orbit track)
MOPITT validation: 40N, 132W 0226 at 2005Z; double spiral bracketing in time the MOPITT overpass. Solid stratus deck with tops at 3.5Kft, otherwise clear sky. Layer at 4-7 km is aged Asian pollution.
MOPITT Validation Profiles during TRACE-P V2 Retrieval: ~20% bias V3 Retrieval: Better agreement • V3 Changes: • Calibration • Recovered data (40%) • Clouds from MODIS • New a priori BLACK=AIRCRAFT RED=AIRCRAFTxAVG KERNELS BLUE=MOPITT Courtesy: Louisa Emmons (NCAR)
NASA Aircraft Flight Tracks During the TRACE-P Mission
Flight Tracks Along the Asian Pacific Rim During the TRACE-P Mission
Frontal outflow of biomass burning plumes E of Hong KongP-3 Hong Kong local 2, March 9 (two days later) Biomass burning CO and total CO forecast (G.R. Carmichael & I. Uno-U. Iowa/Kyushu) Observed CO (G.W. Sachse, NASA/LaRC) Observed aerosol potassium (R. Weber, Georgia Tech) P-3
CO and C2Cl4 Distributions Measured in TRACE-P (G.W. Sachse, NASA/LaRC) (D. Blake, UC-Irvine)
Forecast vs. observed CO: DC-8 Hong Kong local 1, March 7 Observed (G.W. Sachse, NASA/LaRC) GEOS-CHEM forecast (D.J. Jacob, Harvard)
Mixing of biomass burning pollution with industrial pollution in FRONTAL OUTFLOW, TRACE-P DC-8 flight #7 (March 7, 2001)
Warm Conveyor Belt Transport of Asian Emissions H. Liu, Harvard R. Pierce, NASA Langley Biomass Burning CO Anthropogenic CO
Q1: Are our present estimates of Asian CO sources consistent with concentrations of CO measured during TRACE-P? (Use forward model approach: GEOS-CHEM model) P3B, DC8 observations CO Emissions Forward model (Assume linear processes) Inverse model Q2: To what extent can TRACE-P aircraft observations of CO constrain specific Asian sources of CO? (Use inverse model approach: optimal estimation model) (P. Palmer, Harvard)
Forward Model: GEOS-CHEM A priori emissions Global CO emissions (FF, BF, BB) from J. Logan + TRACE-P specific Asian emissions (FF, BF) from D. Streets. Uncertainties assumed 50% (anth), 25% (chem) 1943 FF+BF BB 0 – 2 km 2 - 4 km GEOS-CHEM Observations
Inverse Model Results A posterioriemissions – % Change BB FF+BF results are robust; BB results are tentative FF+BF 0 – 2 km 2 - 4 km GEOS-CHEM Observations
Temporal and Latitudinal Sampling Overlap >25°N <25°N • Fourteen day overlap. • Average TRACE-P sampling about 20 days later than PEM-West B
Ozone in the troposphere at four locations in the western Pacific Tsukuba (36N) Kagoshima (32N) Naha (26N) Hong Kong (23 N) S. Oltmans, NOAA CMDL
PRELIMINARY CONCLUSIONS FROM TRACE-P • Cold fronts are the major mechanism for outflow from Asia to the Pacific in spring. • Biomass burning is a major component of Asian outflow in spring. • Current estimates of anthropogenic emissions in East Asia appear to be too low. • Comparison with PEM-West B (1994) suggests that emissions are not significantly higher during TRACE-P (2001).